The electrocardiogram (ECG) reads, “Acute Myocardial Infarction,” on the 29 year-old athletic man who comes in for a left biceps tendon tear after being in the weight room. “Now what,” thinks the ER doctor? Other electrocardiographic findings may mimic a myocardial infarction. Here I discuss some of them and what to think.
ST and T Wave Changes vs. Q Waves
Significant Q-waves on an electrocardiogram defines a myocardial infarction. A Q-wave is significant if it is >0.04 seconds (1 little box wide) and >1/4 the size of the R-wave. The ST and T waves determine the timing of a myocardial infarction (acute, recent, age undetermined, old). ST segment elevation without Q-waves can also indicate injury to the myocardium. Other non-ischemic conditions can also cause Q-waves or ST and T wave changes (1).
ST And T Wave Changes That Do Not Indicate Injury Or Myocardial Infarction
ST segment elevation may indicate acute myocardial infarction or myocardial injury, but may also be due to other conditions. Examples are early repolarization, acute pericarditis, and secondary ST and T wave changes.
Early repolarization
The early repolarization pattern usually entails diffuse ST segment elevation and may be seen as a normal variant in people under 55 years-old. By definition, there is either a sharp, well-defined positive deflection or notch immediately following a positive QRS complex, at the onset of the ST segment, or a slurring at the terminal part of the QRS complex. The ST segment is usually concave upward. This elevation is usually greater than one little box tall, in two or more contiguous (adjacent) leads (2).
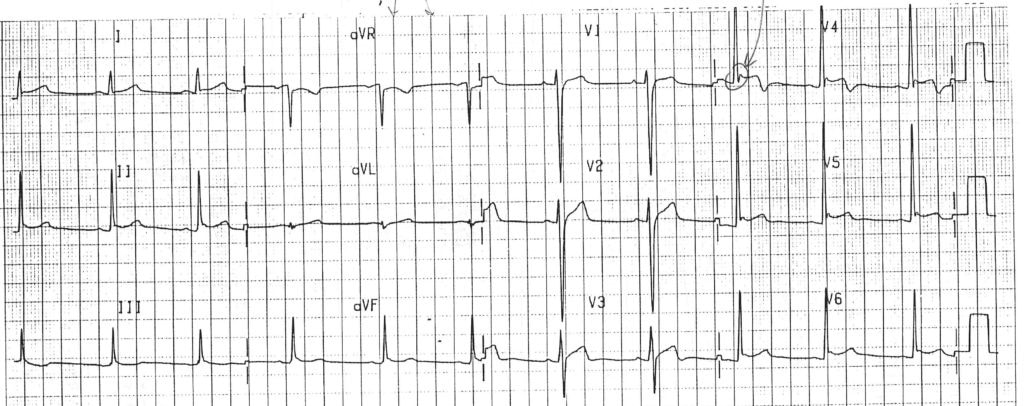
Fig 1: Early repolarization in a 24 year old healthy man (notch at end of QRS complex and ST segment elevation; ST segments are concave upward)
Acute Pericarditis
Acute pericarditis can also mimic a myocardial infarction. Diffuse ST segment elevation and PR segment depression is typical on the electrocardiogram. These changes typically accompany symptoms like sharp, stabbing chest pain behind the breastbone or in the left side of chest (2). The pain intensifies when the patient coughs, lies down or inhales deeply. Sitting up and leaning forward can often ease the pain (2). Patients may also have fever, malaise, palpitations and cough (2).
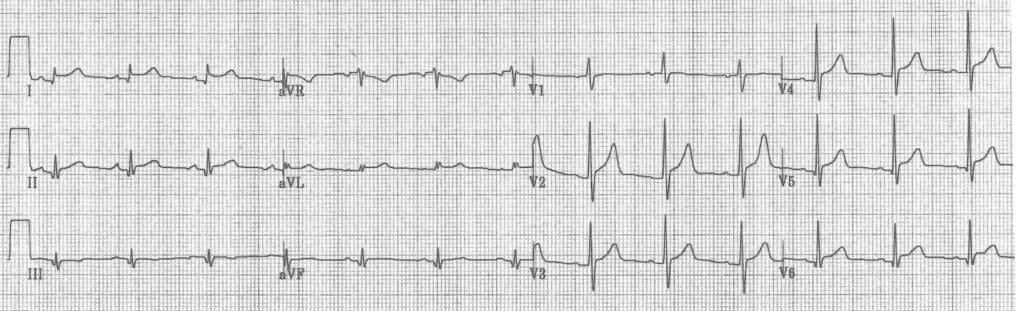
Fig 2: Pericarditis in 30 year old woman (diffuses ST segment elevation and PR segment depression)
Secondary ST and T wave Changes
Secondary ST and T wave changes, also called “repolarization abnormalities” or “strain,” can mimic a myocardial infarction on the ECG. In secondary ST and T changes, the ST and T waves will going in the opposite direction as the QRS complexes. For example, if the QRS complexes are inverted, the ST and T waves will be elevated. These ST and T wave changes are due to a depolarization problem, not myocardial injury. Left ventricular hypertrophy and left bundle branch blocks are examples of conditions that cause secondary ST and T wave changes.
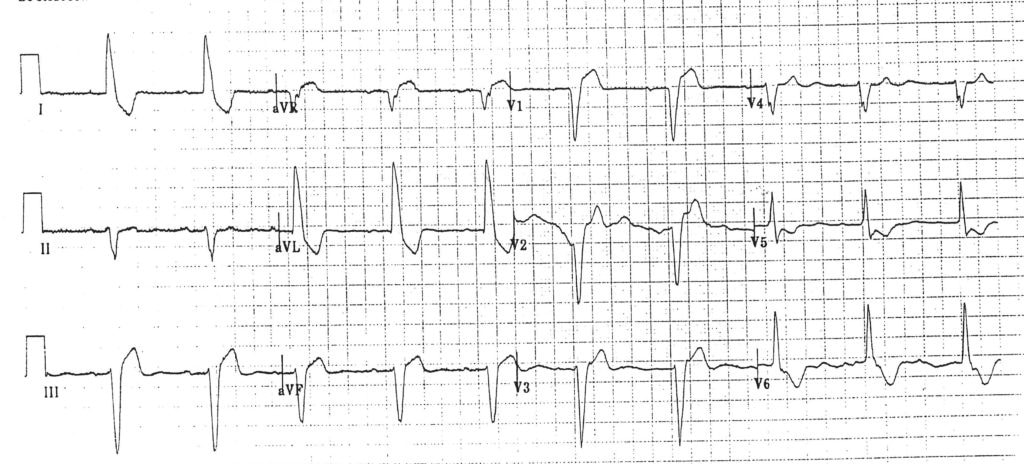
Fig 3: Secondary ST and T wave changes in a 72 year old man with a left bundle branch block (the direction of all of the ST and T waves are opposite to the direction of all of the QRS complexes)
Nonspecific ST and T wave changes
Nonspecific ST segment elevation may also be confused with an acute myocardial infarction. These changes are not diagnostic of injury or other pathology, but can make ECG diagnoses very difficult.
Q Waves
The telltale sign of a myocardial infarction on an electrocardiogram is Q-waves. These are downward deflections prior to R-waves of the QRS complex. Q-waves are considered significant and pathological if they are >0.04 seconds (1 little box) wide, and deeper than 1/4 the height of the R wave. Other conditions can cause Q-waves besides myocardial infarctions. Small Q-waves, representing initial depolarization of the intraventricular septum, are normal and commonly seen in the inferior and anterolateral leads (leads 3, aVF, aVL, 1, V5 and V6) (3,4). Q-waves are abnormal in leads V2-V3. Pseudo Q-waves can be seen with left bundle branch block, left ventricular hypertrophy, right ventricular hypertrophy, left anterior fascicular block, preexcitation, Wolff Parkinson White Syndrome, abnormal rotation of the heart (e.g. late transition), pulmonary disease (emphysema, cor pulmonale, acute pulmonary embolism), and chest lead misplacement (5).
Conclusion
Certain findings on electrocardiograms may mimic a myocardial infarction. Q-waves or ST segment elevation, caused by a multitude of other conditions, may be seen. It is important to take a careful history and physical in addition to scrutinizing the ECG before jumping prematurely at a diagnosis.
Definitions, classifications and criteria can be found at ecgedu.com, Executive Electrocardiogram Education.
References
(1) Siegal, S. ST and T Wave Changes. Executive Electrocardiogram Education. 2018.
https://ecgedu.com/ST and T Wave Changes.
(2) MayoClinic Patient and Health Care Website, Pericarditis. https://www.mayoclinic.org/diseases-conditions/pericarditis/symptoms-causes/syc-20352510.
(3) Analysis and Interpretation of the Electrocardiogram, Step 8: Assess Q waves and determine significance. Queens University. https://meds.queensu.ca/central/assets/modules/ts-ecg/step_8_assess_q_waves_and_determine_significance.html.
(4) Burns, E. Q Waves. Life In The Fast Lane. 11/25/2018. https://litfl.com/q-wave-ecg-library/
(5) ECG Challenges: Myocardial Infarction Mimics Q Waves. AACN Advanced Critical Care October/December 2007, Volume :18 Number 4 , page 440 – 444 [Free].
https://www.nursingcenter.com/journalarticle?Article_ID=751949&Journal_ID=230572&Issue_ID=751906.