The T-wave is an important indicator for understanding and monitoring the health of the heart. T-wave abnormalities are incompletely understood and are associated with a wide differential diagnosis.
Thus, a T-wave abnormality may indicate a life-threatening disease or be completely benign. In fact, benign abnormalities occur in at least half of the leads on a 12-lead ECG.
Let us examine the significance of T waves, their function in ventricular repolarization, and how the T waves on an ECG can be interpreted in diagnosing heart disease.
What Is the T Wave On An ECG?
The T wave on an ECG (electrocardiogram) represents the repolarization of the ventricles in the heart. It is the part of the ECG waveform that follows the QRS complex and precedes the next P wave. The shape and duration of the T-wave can provide important information about the heart’s electrical stability and overall heart health.
Definition And Location On An ECG
The T wave is located after the QRS complex and typically appears as a positive deflection. It reflects the ventricular repolarization process- when cardiac muscle cells reset their electrical charge after contraction.
In terms of morphology, normal T waves are usually smooth and rounded, as opposed to inverted or abnormally tall waves, which may indicate underlying problems. In addition to size and shape, other attributes such as duration and timing also play an important role in accurate ECG analysis.
For example, abnormalities such as peaked or elongated T waves can indicate conditions ranging from myocardial infarction to electrolyte imbalances.
Normal Characteristics And Functions
Normal T waves are typically upright and generally follow the same direction as the QRS complexes. Therefore, the T waves are upright (positive deflection) in leads 1, 2, aVL, aVF, and V2 through V6 are upright (positive deflection). In aVR, the T waves are typically downward (negative deflection). In leads 3 and V1, the direction of the T-waves is variable.
Normal T-waves have a slightly asymmetric shape with a rounded peak closer to their end than to their beginning. The asymmetry is due to a steeper downslope than the upslope of the wave.
To better understand the T-wave, we should first briefly discuss depolarization and repolarization. These two processes represent a shift in the electrical potential and ions in the cells. This occurs mainly due to sodium, potassium, and calcium ions.
Ventricular Depolarization & Repolarization
In the ECG, depolarization is represented by the QRS complexes, whereas T waves represent repolarization. During depolarization, the ventricles contract and pump blood; during repolarization, the ventricles relax and fill with blood.
Ventricular repolarization restores the electrical charges within myocardial cells after each contraction and prepares them for subsequent action potentials. This process ensures proper heart function and effective blood circulation in our body.
This phase follows depolarization and allows the heart muscle cells to return to their resting state after a successful contraction.
In a normal ECG tracing, the T wave appears as a slightly asymmetric curve that directly follows the QRS complex. During ventricular repolarization, ion channels in cardiomyocytes open and close strategically to regulate heart rate
A well-functioning ventricular repolarization allows efficient relaxation of the cardiac muscles after each contraction and maintains optimal coordination between the atria and ventricles during subsequent beats.
Ionic Changes of Ventricular Depolarization and Repolarization
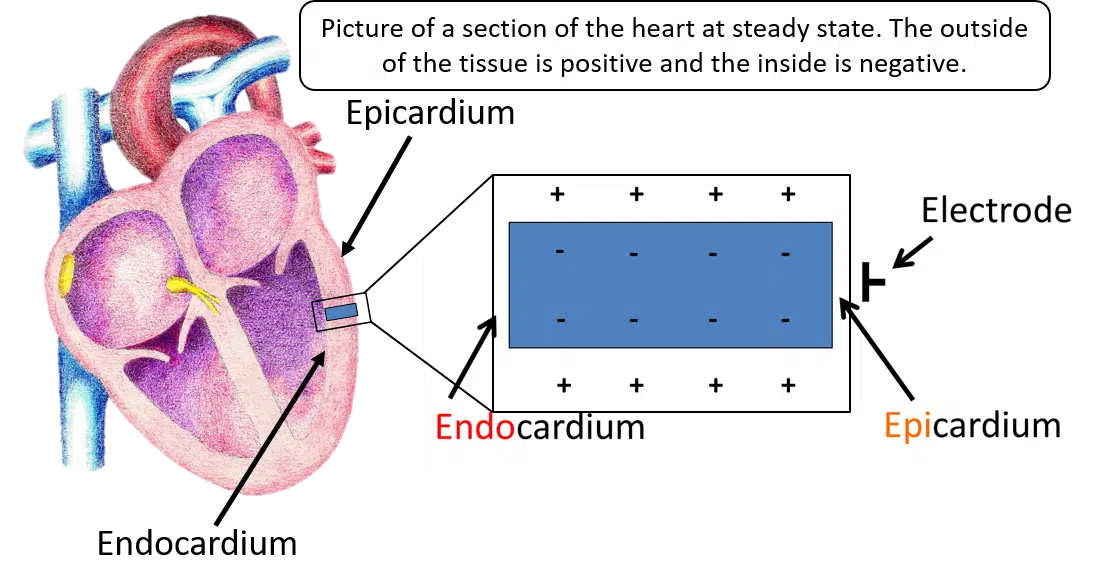
At baseline, the outside of these cells is positive in relation to the inside of the cells. As depolarization begins, the positive ions flood the cells making the inside positive. Repolarization is resetting of the ions, restoring the inside to negative and the outside to positive. Both depolarization and repolarization occur from the epicardium to the endocardium (outside of the heart to the inside of the heart).
On the ECG, the QRS complexes represent depolarization, and the T wave represents repolarization. Depolarization is when the ventricles contract and pump blood, and repolarization is when the ventricles relax and fill with blood.
Let’s look at this process in picture form and then show what the ECG machine sees. Here is a piece of cardiac tissue. The endocardium is to the left, and the epicardium is to the right. During the tissues resting state, the outside of the tissue is positive, while the inside is negative.
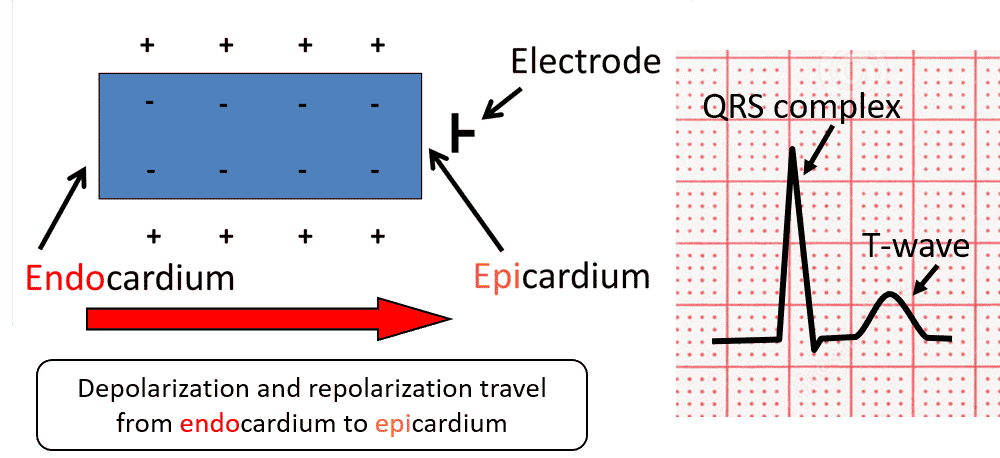
During depolarization, the inside of the tissue becomes positive from left to right. The ECG sees this impulse going toward the electrode and gives a positive or upright deflection. There is then a slight pause in the ion transfer process displayed on the ECG as a flat line (ST segment). This is followed by repolarization (resetting of the ions). Since this process also occurs from the endocardium to the epicardium (left to right), the T waves will be in the same direction as the QRS complexes – upright.
Factors Influencing T Wave Morphology
T wave changes are generally divided into primary and secondary. For simplicity, primary T wave changes are due to a problem in repolarization or resetting of the cardiac electrical system. A classic example of this is cardiac ischemia. Secondary T wave changes result from problems in depolarization. A good example of this is the ST and T wave changes that occur in a bundle branch block.
Primary T-wave changes typically involve the T-wave alone, and the T-waves appear symmetrical. Secondary T-wave changes usually affect the ST segments as well, and the T-wave changes are asymmetrical.
T-wave morphology and duration can be influenced by various physiological and pathological factors that may affect the repolarization process. One of the most important factors is heart rate.
Higher heart rates may result in a shorter QT interval and T-wave duration, whereas slower heart rates may prolong these intervals. As such, ECG readers always need to use the heart rate to calculate a corrected QT interval (QTc).
Electrolyte imbalances are another important factor affecting ECG T waves. For example, hypokalemia may result in flattened or inverted T waves, whereas hyperkalemia may cause tall peaked T waves.
Other physiological conditions such as hyperthyroidism, myocardial ischemia, and genetic disorders like long QT syndrome can also influence T-wave morphology on an ECG.

Start Your Membership Today
We make electrocardiogram interpretation simple and understandable. The videos are interactive, and have detailed, easy to follow illustrations.
Abnormal T Waves And Their Significance
Abnormal T waves, such as inverted, tall, and flat T waves, are associated with a broad range of differential diagnoses and can provide important clues for the diagnosis of heart disease.
Inverted T Waves
Inverted T waves on an ECG are considered abnormal when the inversion is deeper than 1.0 mm and can indicate life-threatening events such as acute coronary ischemia, pulmonary embolism, or CNS damage.
In some cases, diffusely inverted T waves may occur during the evolving phase of pericarditis or myocarditis. Prominent T-wave inversions may also occur in Takotsubo syndrome (stress syndrome).
Non-ST-segment elevation acute coronary syndromes that involve myocardial damage are closely associated with T-wave abnormalities. Realize, though, that inverted T waves may be completely benign, as in persistent juvenile T-wave inversion and normal variant T-wave inversions.
Inverted T waves may be seen in the following conditions:
- Normal findings in children
- Persistent juvenile T wave pattern
- Coronary artery disease
- Myocardial ischemia and infarction (including Wellens Syndrome)
- Bundle branch block ventricular paced (implanted pacemaker) patterns
- Pulmonary embolism
- Hypertrophic cardiomyopathy
- Raised intracranial pressure
Tall T Waves
Tall T waves on an ECG are a significant finding that should be closely monitored by healthcare professionals. An upright T wave in V1 is considered abnormal, especially if it is tall (TTV1), and especially if it is new (NTTV1).
Tall, peaked T waves may be associated with various conditions such as hyperkalemia or myocardial ischemia. The significance of tall T waves depends on the patient’s clinical history and other electrocardiogram findings.
Patients with tall T waves may be at risk of life-threatening arrhythmias such as ventricular tachycardia or ventricular fibrillation.
Flat T Waves
Flat T waves are one of the abnormalities associated with T waves on an ECG. This type of abnormal T wave has a low amplitude and may indicate several conditions, including electrolyte disturbances such as hypokalemia, ischemic heart disease, myocardial injury, and drug effects.
It is important to identify flat T waves because they can be dangerous if left unchecked. If not addressed promptly, they can develop into more serious problems such as arrhythmias or even sudden death from ventricular fibrillation. Flat T waves may also be benign and a non-specific finding.
The typical small U wave is more prominent with hypokalemia and digitalis toxicity. As hypokalemia worsens, the T wave becomes increasingly flattened while the U wave becomes more prominent. With digitalis toxicity, the ST segment typically shortens and sags before the T waves flatten and U waves develop.
Flattened T waves can be caused by the following:
- Myocardial ischemia
- Emphysema
- Pericardial effusion
- Hypothyroidism
- Hypoadrenalism
- Hypokalaemia
- Hypocalcemia
- Digitalis therapy
Biphasic T Waves
Biphasic, also called diphasic T waves, have positive and negative deflections. In other words, two waves are present in opposite directions.
There are two main causes of biphasic T waves, each with a different biphasic pattern.
- Myocardial ischemia – in MI the T wave is initially positive and then transitions to terminal negativity.
- Hypokalemia – the T wave is initially negative and transitions to terminal positivity.
Hyperacute T Waves
Hyperacute T waves have an amplitude higher than 10 mm in the chest leads, and greater than 5 mm in the limb leads. They are broad-based with a peaked, symmetrical morphology.
After QT protraction, hyperacute T waves are the earliest ECG sign of acute ischemia.
Hyperacute T waves are most evident in the anterior chest leads and occur shortly after coronary infarction. They are usually of short duration.
Causes of hyperacute T waves include acute myocardial infarction, hyperkalemia, and acute myopericarditis.
Camel Hump T Waves
As the name implies, camel hump T waves exhibit double peaks. Originally, these waves were associated with hypothermia but are now considered nonspecific.
Because they are triggered by different events, they are difficult to interpret.
Dramatic ECG changes of camel hump T waves have been observed in various electrolyte imbalances. For example, elevated U waves occur at the end of the T wave in severe hypokalemia. P waves are embedded in the T wave in various types of heart block and tachycardia.
Other Abnormalities And Their Implications
In addition to inverted, tall, and flat T waves, there are other abnormalities that can be seen on an ECG. For example, biphasic T waves occur when the wave changes direction midway through its course.
This may indicate myocardial ischemia or infarction.
Diphasic T waves that have both positive and negative deflections within a single wave cycle may indicate early repolarization syndrome (ERS), a benign cardiac condition commonly seen in young adults.
Interpretation of abnormal T waves requires not only knowledge but also experience to effectively distinguish them from normal variants.
Clinical Applications Of T Wave Analysis
T-wave changes may indicate various pathologies, including cardiac disease, pulmonary disease, neurogenic causes, and multiple electrolyte imbalances. However, T-wave changes may also be a normal variant.
Interpreting abnormalities in the T-wave without clinical history, physical examination, and laboratory studies is a common mistake. T-wave abnormalities are nonspecific in the absence of symptoms and clinical history. Therefore, a comprehensive understanding of the T-wave is critical for accurate diagnosis and optimal patient care. Here are some of the most important clinical applications for T-wave analysis.
Diagnosing Cardiovascular Disorders
Diagnosis of cardiac disorders is a critical aspect of patient care. Understanding the T wave on an ECG can aid in diagnosing several cardiac conditions. Here are some examples of different cardiac disorders that can be diagnosed:
- Cardiomyopathy
- Coronary artery disease
- Myocardial infarction
- Heart failure
- Cardiac arrhythmia
- Pulmonary embolism
- Ischemia
- Ventricular hypertrophy
- Atrial fibrillation
By evaluating T-wave changes on an ECG, medical professionals can diagnose these conditions early and create comprehensive treatment plans to achieve optimal patient outcomes.
Predicting Cardiac Events
The significance of the T wave on an ECG goes beyond its representation of ventricular repolarization. When interpreted correctly, T waves can be useful in predicting cardiac events in patients.
One example is the use of ambulatory ECG-based T-wave alternans (AECG), which have been identified as predictors of cardiac events such as sudden cardiac death and arrhythmias. In addition, clinical risk stratification for sudden cardiac death includes the presence of reduced left ventricular ejection fraction and T-wave alternans.
Identification Of Electrolyte Imbalances
Electrolyte imbalances can be detected by changes in the T wave on an ECG, making T wave interpretation a valuable tool for clinicians. Here are some important points to consider:
- Potassium imbalance can cause peaked or tall T waves on an ECG, which is an early sign of hyperkalemia.
- Low potassium or hypokalemia can cause flattened or inverted T waves.
- Imbalanced calcium levels can cause QT prolongation, QT shortening, and abnormal T waves.
- Magnesium imbalance may also contribute to QT interval changes and abnormal T waves.
Detection of these electrolyte abnormalities by T-wave analysis can lead to immediate treatment and potentially prevent more serious cardiac events. Understanding the significance of the T wave on an ECG is critical for clinicians when interpreting 12-lead electrocardiogram abnormalities associated with cardiovascular disease.
Monitoring Drug Therapies
Monitoring drug therapies is one of the most important clinical applications of T-wave analysis. Understanding the T waves on an ECG can help assess the efficacy of various drug treatments and identify any adverse effects that may result.
By monitoring drug therapies using T-wave analysis, physicians can tailor treatment plans for their patients to meet specific needs and minimize the risks associated with different drugs.
Use In Drug-induced QT Prolongation Monitoring
Drug-induced QT prolongation can be monitored using the T wave in the ECG. When prescribing drugs associated with QT prolongation, three key factors should be considered: drug metabolism, patient-specific factors, and concurrent medications.
To measure the QT interval, clinicians should measure it manually from the initial inflection of the Q wave to the end of the T wave on an ECG. It is recommended to use one of the limb leads that best shows the end of the T wave on a 12-lead ECG. Manual measurement is important because computerized measurements are not always accurate, especially in the presence of marked repolarization abnormalities or irregular rhythms.
Clinicians should evaluate for clinical risk factors such as electrolyte imbalances, bradycardia, heart failure, and genetic predisposition before initiating therapy with a drug that has proarrhythmic potential.
Start Your Membership Today
We make electrocardiogram interpretation simple and understandable. The videos are interactive, and have detailed, easy to follow illustrations.
Learn To Master The Art Of ECG Interpretation
Learning how to interpret T-waves on an ECG is just one part of ECG interpretation, but it’s a critical skill that healthcare providers must master. At Executive Electrocardiogram Education, our ECG interpretation courses make electrocardiogram interpretation simple and easy to understand. Our self-paced video courses give a one-on-one feel to learning to read ECGs.
If you’d like to try one of our courses for free, you can try our ACLS rhythms course. It’s ideal for anyone looking for a basic overview of ECG interpretation or just to get a feel for how our online ECG courses work.