Abbreviations:
- ECG – electrocardiogram
- RAD – right axis deviation
- RVH – right ventricular hypertrophy
ECGs are good screening tests to look for certain cardiac abnormalities. There are distinct ECG criteria identifying right ventricular hypertrophy (RVH), which can be easily memorized and ascertained with a little knowledge of cardiac anatomy and electrical conduction properties. Below, I describe right ventricular hypertrophy, how to make the ECG diagnosis and some other tests that may be beneficial.
What is Right Ventricular Hypertrophy?
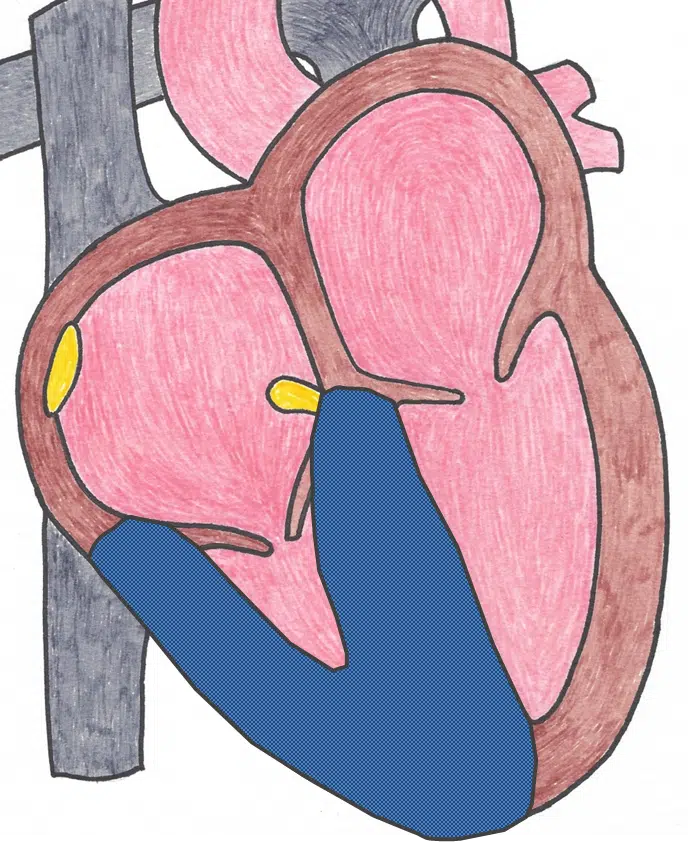
The human heart is a double pump system. The right ventricle pumps blood to the lungs, whereas the left ventricle pumps blood to the body. Right ventricular hypertrophy is a thickening of the muscle of the right ventricle. Conditions that cause RVH include narrowing of the outflow tract of the right ventricle, backflow of blood through the tricuspid valve (tricuspid valve regurgitation), or conditions that increase the pulmonary artery pressure (blood pressure of the lungs). Common symptoms of right ventricular hypertrophy are shortness of breath, palpitations, fainting, and fluid buildup in the abdomen and lower extremities. Since many other conditions can also cause these symptoms, cardiology consultation is advised.

Start Your Membership Today
We make electrocardiogram interpretation simple and understandable. The videos are interactive, and have detailed, easy to follow illustrations.
Diagnosis of Right Ventricular Hypertrophy
After a detailed history and physical examination, medical providers often obtain an electrocardiogram (ECG), chest x-ray, and an echocardiogram (echo) to make the diagnosis. Sometimes the provider will also order a cardiac MRI (magnetic resonance imaging), a heart catheterization, and other tests to determine the etiology of increased pulmonary artery pressure.
ECG Findings in Right Ventricular Hypertrophy
Right ventricular hypertrophy causes distinct changes on the electrocardiogram (ECG). Although there are multiple criteria, most of the time you only need to know two of these to make the diagnosis. I will now describe the basic criteria and explain why they occur.
Electrocardiographic Criteria for RVH
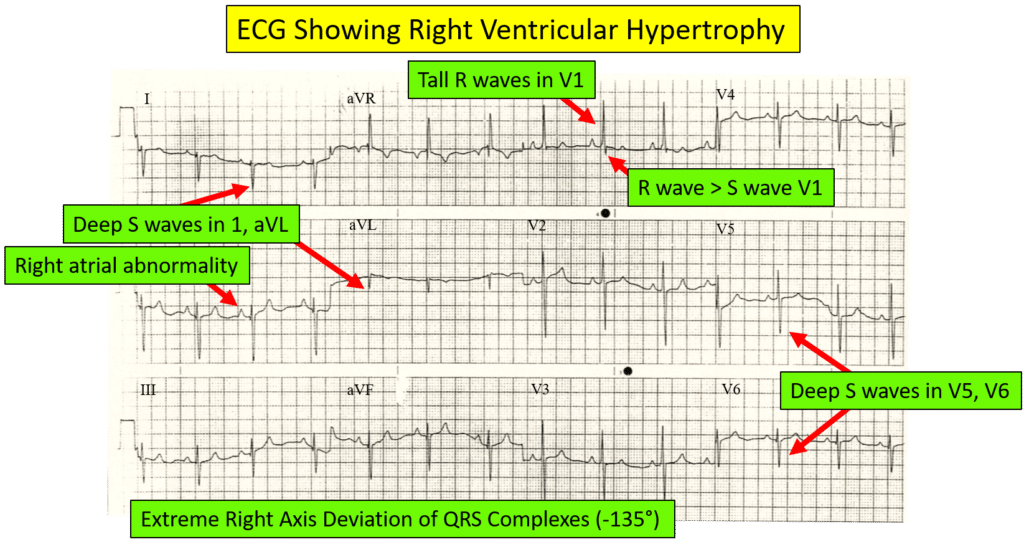
For simplicity, the ECG diagnosis of RVH involves three criteria:
- Right axis deviation (RAD)
- A tall, narrow R wave in lead V1
- An R wave taller than the S wave in lead V1
For completeness below is a list of more specific ECG criteria for diagnosing RVH.
- R in V1 greater than 6 mm
- R in V1 + S in V5 or V6 greater than 10.5 mm
- R/S ratio in V1 greater than 1
- S/R ratio in V6 greater than1
- Late intrinsicoid deflection in V1 (greater than 0.035 seconds)
- Incomplete right bundle branch block
- ST-T wave abnormalities (“strain”) in inferior and anterior leads
- Right atrial abnormality (“P pulmonale”)
- S greater than R in leads I, II, III, particularly in children (S1S2S3 pattern)
Download Our Full ECG Course Syllabus
Enter your email address and we will send you a copy of our course syllabus and ECG-At-A-Glance.
Why The ECG Sees These Findings
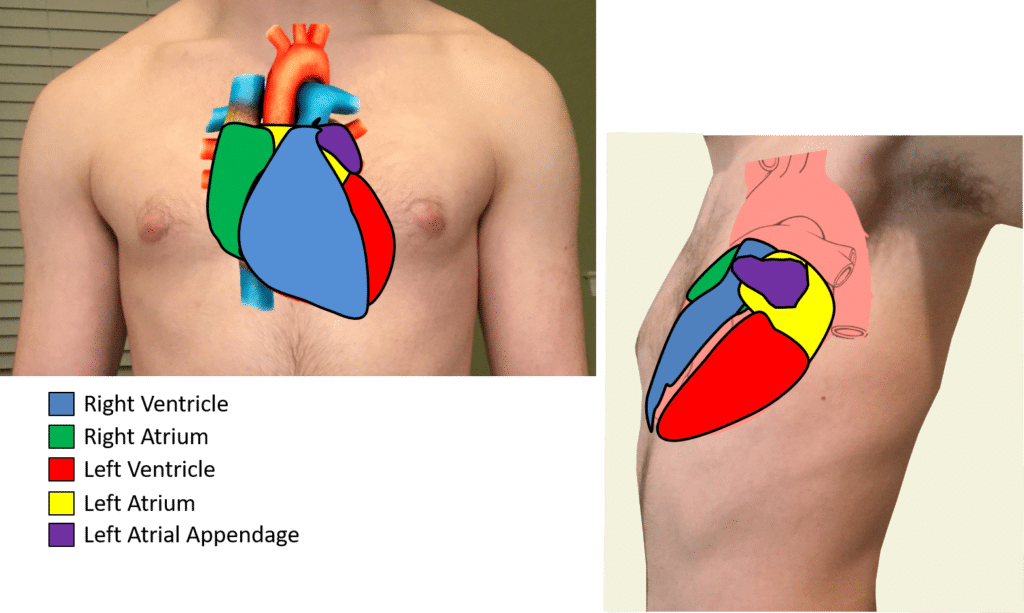
If you remember that electrical impulses are pulled toward areas of hypertrophy, and travel away from areas of dead myocardial tissue, the basis of the criteria is easy to understand. The right ventricle is the most anterior chamber of the heart. It also sits to the right side of the chest (see below).
Since the right ventricle has more muscle mass, then the electrical impulses are pulled toward the right ventricle and away from the left and posterior portion of the heart. As such, the leads that are anterior and right, such as lead V1 and V2 will see tall R waves. Remember that normally there is a dominant downward deflection in leads V1 and V2. Similarly, since the electrical impulses are being pulled away from the left and posterior, then leads V5, V6, 1, and aVL will have deep S waves. Likewise, the impulses being pulled to the right cause a right axis deviation.
Approach to Reading an ECG to identify Right Ventricular Hypertrophy
General Approach To ECG Interpretation
In my online ECG video course (ecgedu.com), I teach a detailed approach to ECG interpretation. It starts with determining the heart rate, the heart rhythm, and the waveform axes (P wave axis, QRS axis, and T wave axis). Next look at the intervals (PR interval, QRS interval, and QT interval). Waveforms interpretation follows. Look at the P wave, Q waves, QRS complexes, ST segments, and T waves. This approach allows the reader to come up with proper ECG diagnoses, and hopefully clinical diagnoses.
Approach To ECG interpretation of RVH
When you follow the approach above, there are several steps that clue in the ECG reader about right ventricular hypertrophy. First, the QRS axis is rightward. It is >90 degrees and often >110 degrees. When right axis deviation of the QRS complex is seen, then RVH should immediately be considered. The next clue may occur when the interpreter looks at the P waves. Right atrial abnormality shown by tall peaked P waves in leads 2, 3, and/or aVF may be an associated finding. When viewing the QRS complex, look for tall, narrow R waves in anterior leads (V1 and V2) as well as deep S waves in the inferior and lateral leads (2, 3, aVF, 1, aVL, V5, and V6). Lastly look for secondary ST and T wave changes, particularly in the anterior leads (e.g. depressed/inverted ST and T waves in leads V1 and V2).
Other Tests To Diagnose Right Ventricular Hypertrophy
Providers usually obtain other tests to confirm the diagnosis of RVH.
Chest Radiograph
The chest x-ray may show evidence of right ventricular enlargement, right atrial enlargement, and/or pulmonary hypertension. An enlarged right ventricle fills the retrosternal space, seen on a lateral chest x-ray. An enlarged right atrium extends the right cardiac silhouette well to the right of the sternum on the anterior-posterior (AP) film. Pulmonary hypertension causes the pulmonary arteries to appear enlarged and prominent.
Echocardiogram
Echocardiography is ultrasound imaging of the heart. In RVH, an echocardiogram may show thickening of the right ventricular muscle, and enlargement of the right ventricular cavity. Color flow doppler helps identify and quantify tricuspid regurgitation, which is often present. Continuous-wave Doppler helps quantify pulmonary artery pressure. Other cardiac abnormalities giving clues to the etiology of the RVH may be seen. (Learn to read RVH on echos at pointofcareecho.com)
Cardiovascular Magnetic Resonance
A cardiac magnetic resonance (CMR) image is another good test for scanning the heart. CMR uses the body’s innate magnetic properties to image the heart. As such, CMR can give detailed images of the cardiac structures and help quantify blood flow like tricuspid regurgitation.
Try Our ACLS Rhythm Course For Free!
This course goes through all of the ACLS rhythms. You will be quizzed on each rhythm and then watch the detailed description which points out the salient features.
Conclusion
After a detailed history and physical examination, an ECG is usually the first test used to diagnose heart disease. There are distinct ECG criteria for right ventricular hypertrophy, which are easy to understand with a little knowledge and practice.
References:
https://www.medicalnewstoday.com/articles/318959
What is right ventricular hypertrophy?
Medically reviewed by Graham Rogers, M.D. — Written by Jon Johnson on August 16, 2017
https://www.ncbi.nlm.nih.gov/books/NBK499876/
NCBI Bookshelf. A service of the National Library of Medicine, National Institutes of Health.
StatPearls [Internet]. Treasure Island (FL): StatPearls Publishing; 2021 Jan-.
Right Ventricular Hypertrophy
Authors: Priyanka T. Bhattacharya; Matthew B. Ellison.
https://www.ncbi.nlm.nih.gov/pmc/articles/PMC1121941/
Berger A. Magnetic resonance imaging. BMJ. 2002;324(7328):35. doi:10.1136/bmj.324.7328.35