
You look at an electrocardiogram (ECG) and it says “rSR prime in lead V1 or V2” or “borderline left axis deviation.” What does that mean and what do you do? You’re not alone! Many healthcare professionals encounter common, yet puzzling ECG findings that can be challenging to interpret and manage.
In this article, I’ll review multiple common, but puzzling ECG findings, and explain what they mean and what can be done about them.
Nonspecific Intraventricular Conduction Delay (NS IVCD)
A nonspecific intraventricular conduction delay (IVCD) is a slowing of conduction through the myocardium, that does not meet the criteria of a right or left bundle branch block. Patients with nonspecific intraventricular conduction delays are at almost twice as great a risk of all-cause death and cardiovascular death, as compared with patients without NS IVCDs.
Several underlying conditions can cause NS IVCD, including large myocardial infarctions, myocardial fibrosis, amyloidosis, cardiomyopathies, or ventricular hypertrophy. These conditions can interfere with the heart’s normal electrical conduction pathway and lead to a slower or more disorganized spread of electrical impulses through the ventricles.
RSR’ in V1 or V2
An rSR’ pattern V1 or V2 can be a normal finding or variant in a younger person or athlete. It may also be called an incomplete right bundle branch block and is described as a QRS complex that is < 120 msec with a small R wave, followed by a deeper S wave, and another small R wave seen in V1 and/or V2. The R wave or R prime is not greater amplitude than the S wave. (2) This pattern is not a precursor of a right bundle branch block or any other significant conduction abnormality. (2) Rarely this pattern is seen in atrial septal defects or pulmonary disease with increased right-sided heart pressures.
Q waves
Q waves are an integral part of the electrocardiogram (ECG) waveform and provide crucial information about the heart’s electrical activity, specifically the initial depolarization of the intraventricular septum. As the heart undergoes its normal electrical cycle, a small Q wave can be observed in certain ECG leads, such as leads 3, aVF, aVL, 1, V5, and V6. These small Q waves are considered normal and indicate proper functioning of the heart’s conduction system. When analyzing an ECG, it is essential to recognize and differentiate between normal and abnormal Q waves to accurately assess cardiac health.
Pathological Q waves are found with myocardial infarctions and cardiomyopathies (e.g. hypertrophic cardiomyopathy, infiltrative myocardial diseases such as amyloid), and cardiac tumors. Pseudo Q waves can be seen with left bundle branch block, left ventricular hypertrophy, right ventricular hypertrophy, left anterior fascicular block, preexcitation, Wolff Parkinson White Syndrome, abnormal rotation of the heart (e.g. early and late transition), pulmonary disease (emphysema, cor pulmonale, acute pulmonary embolism, and chest lead misplacement).
Septal Myocardial Infarction
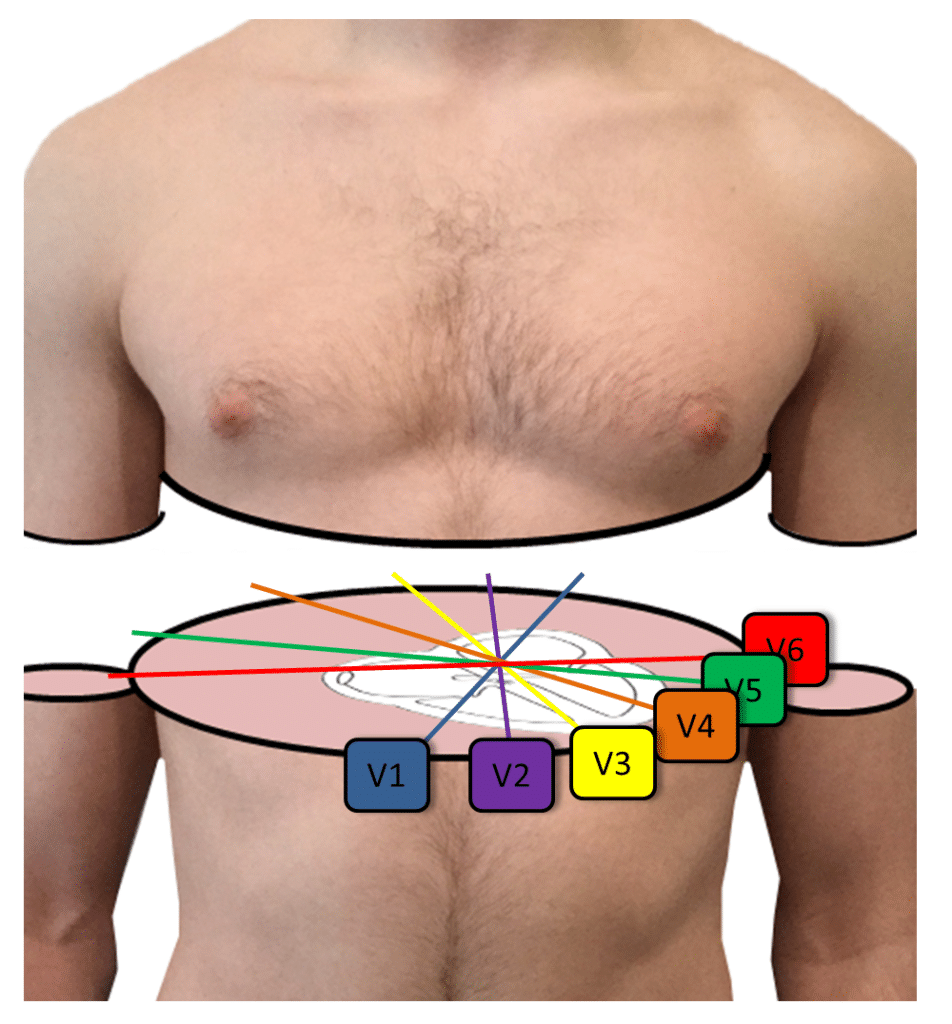
Septal myocardial infarction refers to seeing Q waves in leads V1 and V2. Although a septal myocardial infarction can cause this pattern, it is more commonly caused by cranially misplaced precordial leads V1 and V2 which is a common technical error. (6) Remember that leads V1 and V2 are placed in the 4th intercostal space, to the right and left sternal border, respectively. To find the fourth intercostal space, you first find the ridge on the sternal manubrium (second intercostal space) and then palpate down two intercostal spaces. A description of lead placement can be found at Executive Electrocardiogram Education (ecgedu.com) on the sample videos.
Early Transition
Transition is the axis of the heart in the transverse or horizontal plane. In a normal heart, the transition point, or the point where the QRS complexes appear isoelectric (equal R wave height to S wave depth) is in lead V3 or V4. When the transition point is in lead V1 or V2, this is called early transition and refers to the heart being rotated to the patient’s right, or the forces of depolarization to be more rightward than normal in the horizontal plane. This used to be called counterclockwise rotation. The significance of early transition may be nominal, but conditions that can cause early transition include: improper placement of the leads, electrical shift to the right, right ventricular hypertrophy, Wolff Parkinson White, posterior myocardial infarction, left septal fascicular block, a shift of the septum to the right, hypertrophic cardiomyopathy, and sclerotic lesions of the thoracic aorta. (7)
Late Transition
When the transition point is in lead V5 or V6, this is called late transition and refers to the heart being rotated to the patient’s left, or the forces of depolarization to be more leftward than normal in the horizontal plane. This used to be called clockwise rotation. Conditions that can cause late transition include incorrect lead placement, intraventricular conduction abnormalities secondary to myocardial degeneration, right ventricular heart disease, a shift of the septum to the left, dilated
cardiomyopathy, a shift of the whole heart to the left, pulmonary emphysema, and vertical heart, usually seen in a thin and tall person. (7)

Start Your Membership Today
We make electrocardiogram interpretation simple and understandable. The videos are interactive, and have detailed, easy to follow illustrations.
Poor R Wave Progression
Poor R Wave Progression (PRWP) is a term meaning that the R waves in the precordial (chest) leads do not get taller, as usual from lead V1 to V3, and that the R wave in lead V3 is less than 3 mm in height. Under normal circumstances, the R wave amplitude increases progressively from lead V1 to lead V3 or V4, reflecting the depolarization of the heart’s ventricles that moves from the right side towards the left side.
One of the main reasons for poor R wave progression is an anterior wall myocardial infarction, which can affect the normal depolarization in the affected region of the heart. Other potential causes of PRWP include normal anatomical variations, right ventricular hypertrophy, or incorrect placement of ECG leads.
The main reason to look for this is to consider an anterior wall myocardial infarction. Other conditions, such as a normal variant or right ventricular hypertrophy, can also cause PRWP.
Nonspecific ST and T Wave Changes
Nonspecific ST and T wave changes (NSST&T) refer to variations in the ST segment and T wave on an electrocardiogram (ECG) that deviate from the normal appearance but do not meet the classic criteria for specific cardiac conditions such as ischemia, injury, or other pathological abnormalities. These changes can include subtle alterations in the shape or amplitude of the T wave or slight shifts in the ST segment’s position, either elevated or depressed, compared to the baseline.
The exact cause of nonspecific ST and T wave changes can be elusive and may range from benign variations to early signs of cardiac abnormalities. Some potential causes of NSST&T changes include electrolyte imbalances, medications, stress, or mild ischemia that does not meet the diagnostic threshold for significant ischemic changes. In some cases, these nonspecific changes could be related to non-cardiac factors such as hyperventilation or anxiety.
Although they may be benign, they may also be a clue of cardiac abnormalities, such as ischemia, especially in the setting of cardiac symptoms.
“Cannot Rule Out”
In the context of ECG interpretation, the term “cannot rule out” is used when an abnormal finding is observed but does not provide a definitive diagnosis for a specific cardiac condition. Essentially, it indicates that there is some degree of uncertainty regarding the clinical significance of the observed pattern, and further investigation or monitoring may be required to confirm or exclude a particular diagnosis.
For example, when poor R wave progression is seen in leads V1 through V3, in a patient who also has left ventricular hypertrophy, the ECG reader cannot exclude an anterior wall myocardial infarction (MI). The reader may then say, “Cannot rule out anterior wall MI.”
In these situations, it is important for healthcare professionals to consider the “cannot rule out” finding in conjunction with other clinical data, patient history, and additional diagnostic tests to determine the most appropriate course of action and treatment plan for the patient.
Borderline Left Axis Deviation
Left axis deviation by definition is a coronal QRS axis of more than -30 degrees. Some ECG machines call any axis in the right upper quadrant (between 0 and -90 degrees) left axis deviation. Not infrequently, these computers will call a QRS axis of 0 to -30 degrees, “borderline left axis deviation.” In reality, this term is meaningless and is probably normal.
Learn about puzzling yet common ECG findings, plus much more with Executive Electrocardiogram Education (ecgedu.com), an all-inclusive, online video course. You will learn all of the ECG and arrhythmia basics, such as lead placement, atrial and ventricular arrhythmias, myocardial ischemia, injury, and infarction, plus much more in this comprehensive EKG interpretation class. Additionally, you will learn an approach to reading ECGs and arrhythmias that is not offered in other courses. Check out the sample videos and at the very least sign up for the free advanced cardiac life support (ACLS) video tutorial and quiz.
Learn To Interpret ECGs Today
If you’re interested in learning how to interpret ECGs, we have a variety of great ECG interpretation courses to help you sharpen your skills and even earn CME credits. Whether you’re looking to sign up as an individual student or enroll an institution in a group program, ECGEDU has courses and options for every type of learner. Click here to enroll in ECGEDU today!