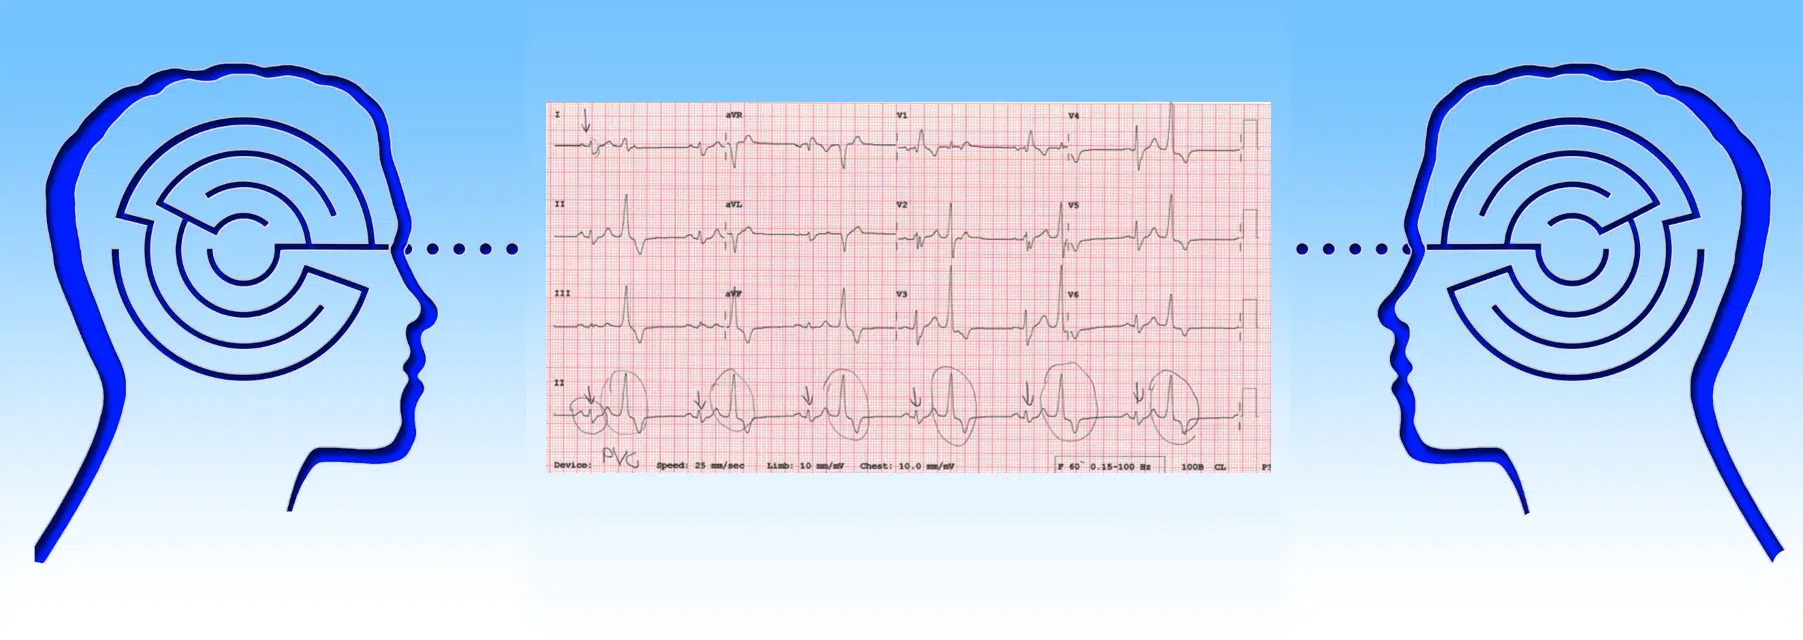
What is the best way to understand an issue? I try to define the terms, deduce how everything fits together, and then make a diagnosis. Reading electrocardiograms (ECGs; EKGs) is no different – Define, Deduce, and Diagnose. As basic as this may sound, interpreting an EKG takes knowing the basic definitions of the waveforms, understanding how and where the criteria come together, and then combining the information to make a diagnosis. In this ECG article, I will start with short ECG questions. Think about how you would answer questions and then we will define the terms, deduce how it all goes together, and then come up with correct ECG diagnoses.
ECG Question #1:
Your colleague from another state calls you on the telephone and says, “I have an ECG in front of me. The computer reads ’inferior wall myocardial infarction.’ What do I look for and will you describe it to me.” Remember that your colleague cannot see you, nor can you point to anything on the ECG. How do you describe this to her?
ECG Response #1:
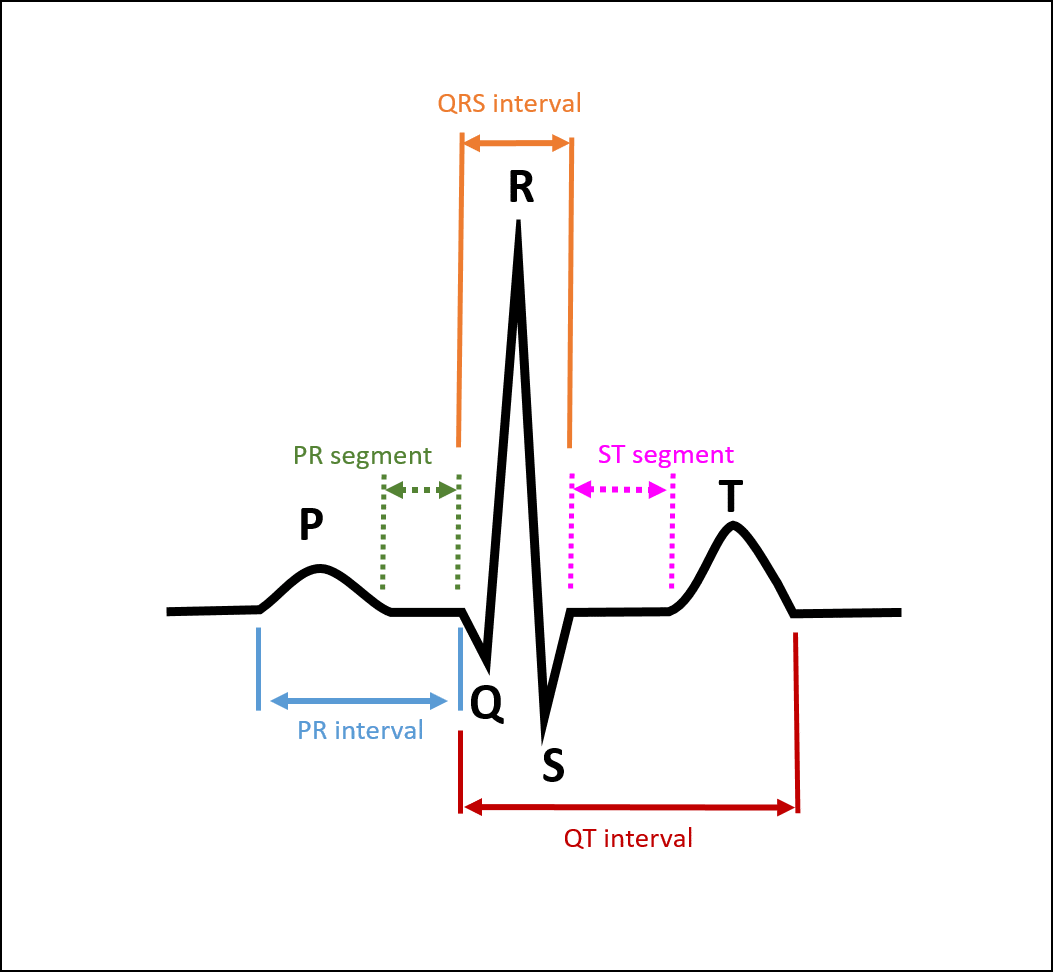
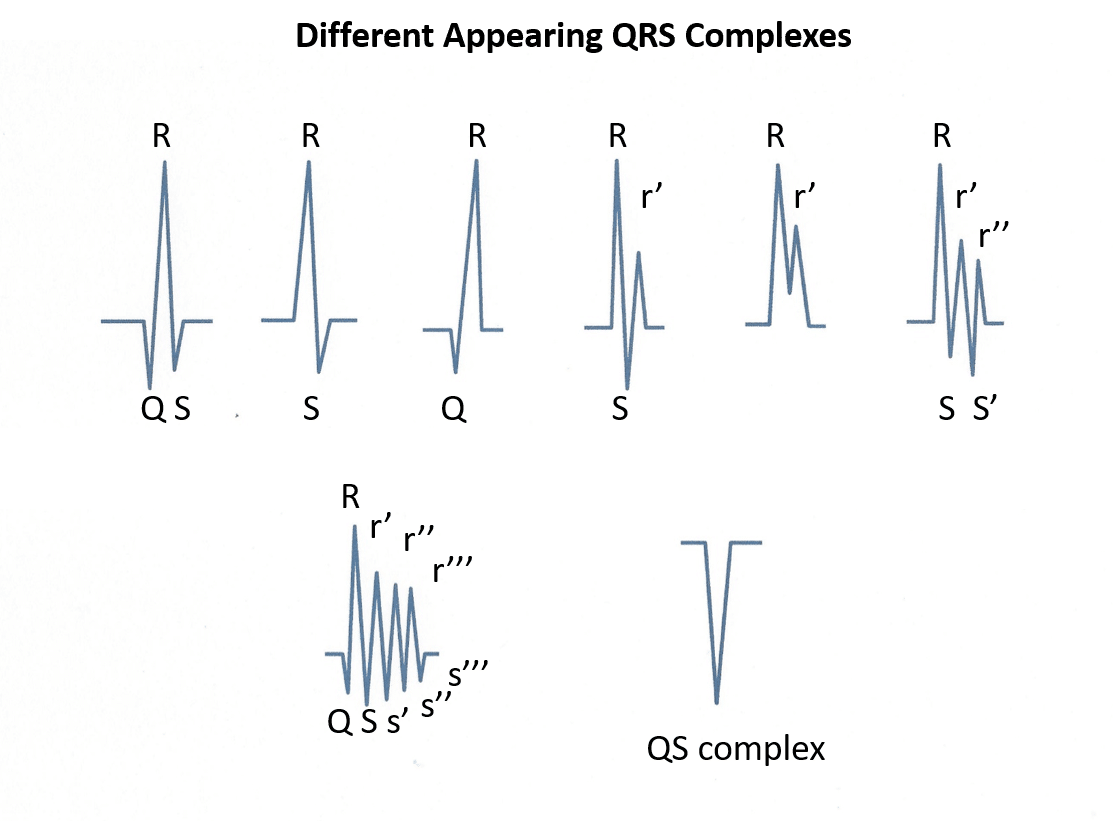
You would say something like this. ”With an inferior wall myocardial infarction, you would expect to find Q waves in the inferior leads. Remember the components of the QRS complex. The first upward deflection or squiggle is an R wave. A downward deflection prior to the R wave is the Q wave. A downward deflection after the R wave is called an S wave. If there is only a downward deflection then this is called a QS complex. Now, look at your ECG and see if there are initial downward deflections, in leads 2, 3, and aVF.”
ECG Solution #1:
Remember – Define, deduce, and diagnose. Based on the question there are several definitions that we need to know. First, which leads represent the inferior portion of the heart? Second, what criteria define a myocardial infarction? We’ll take them one at a time.
Lead Positions
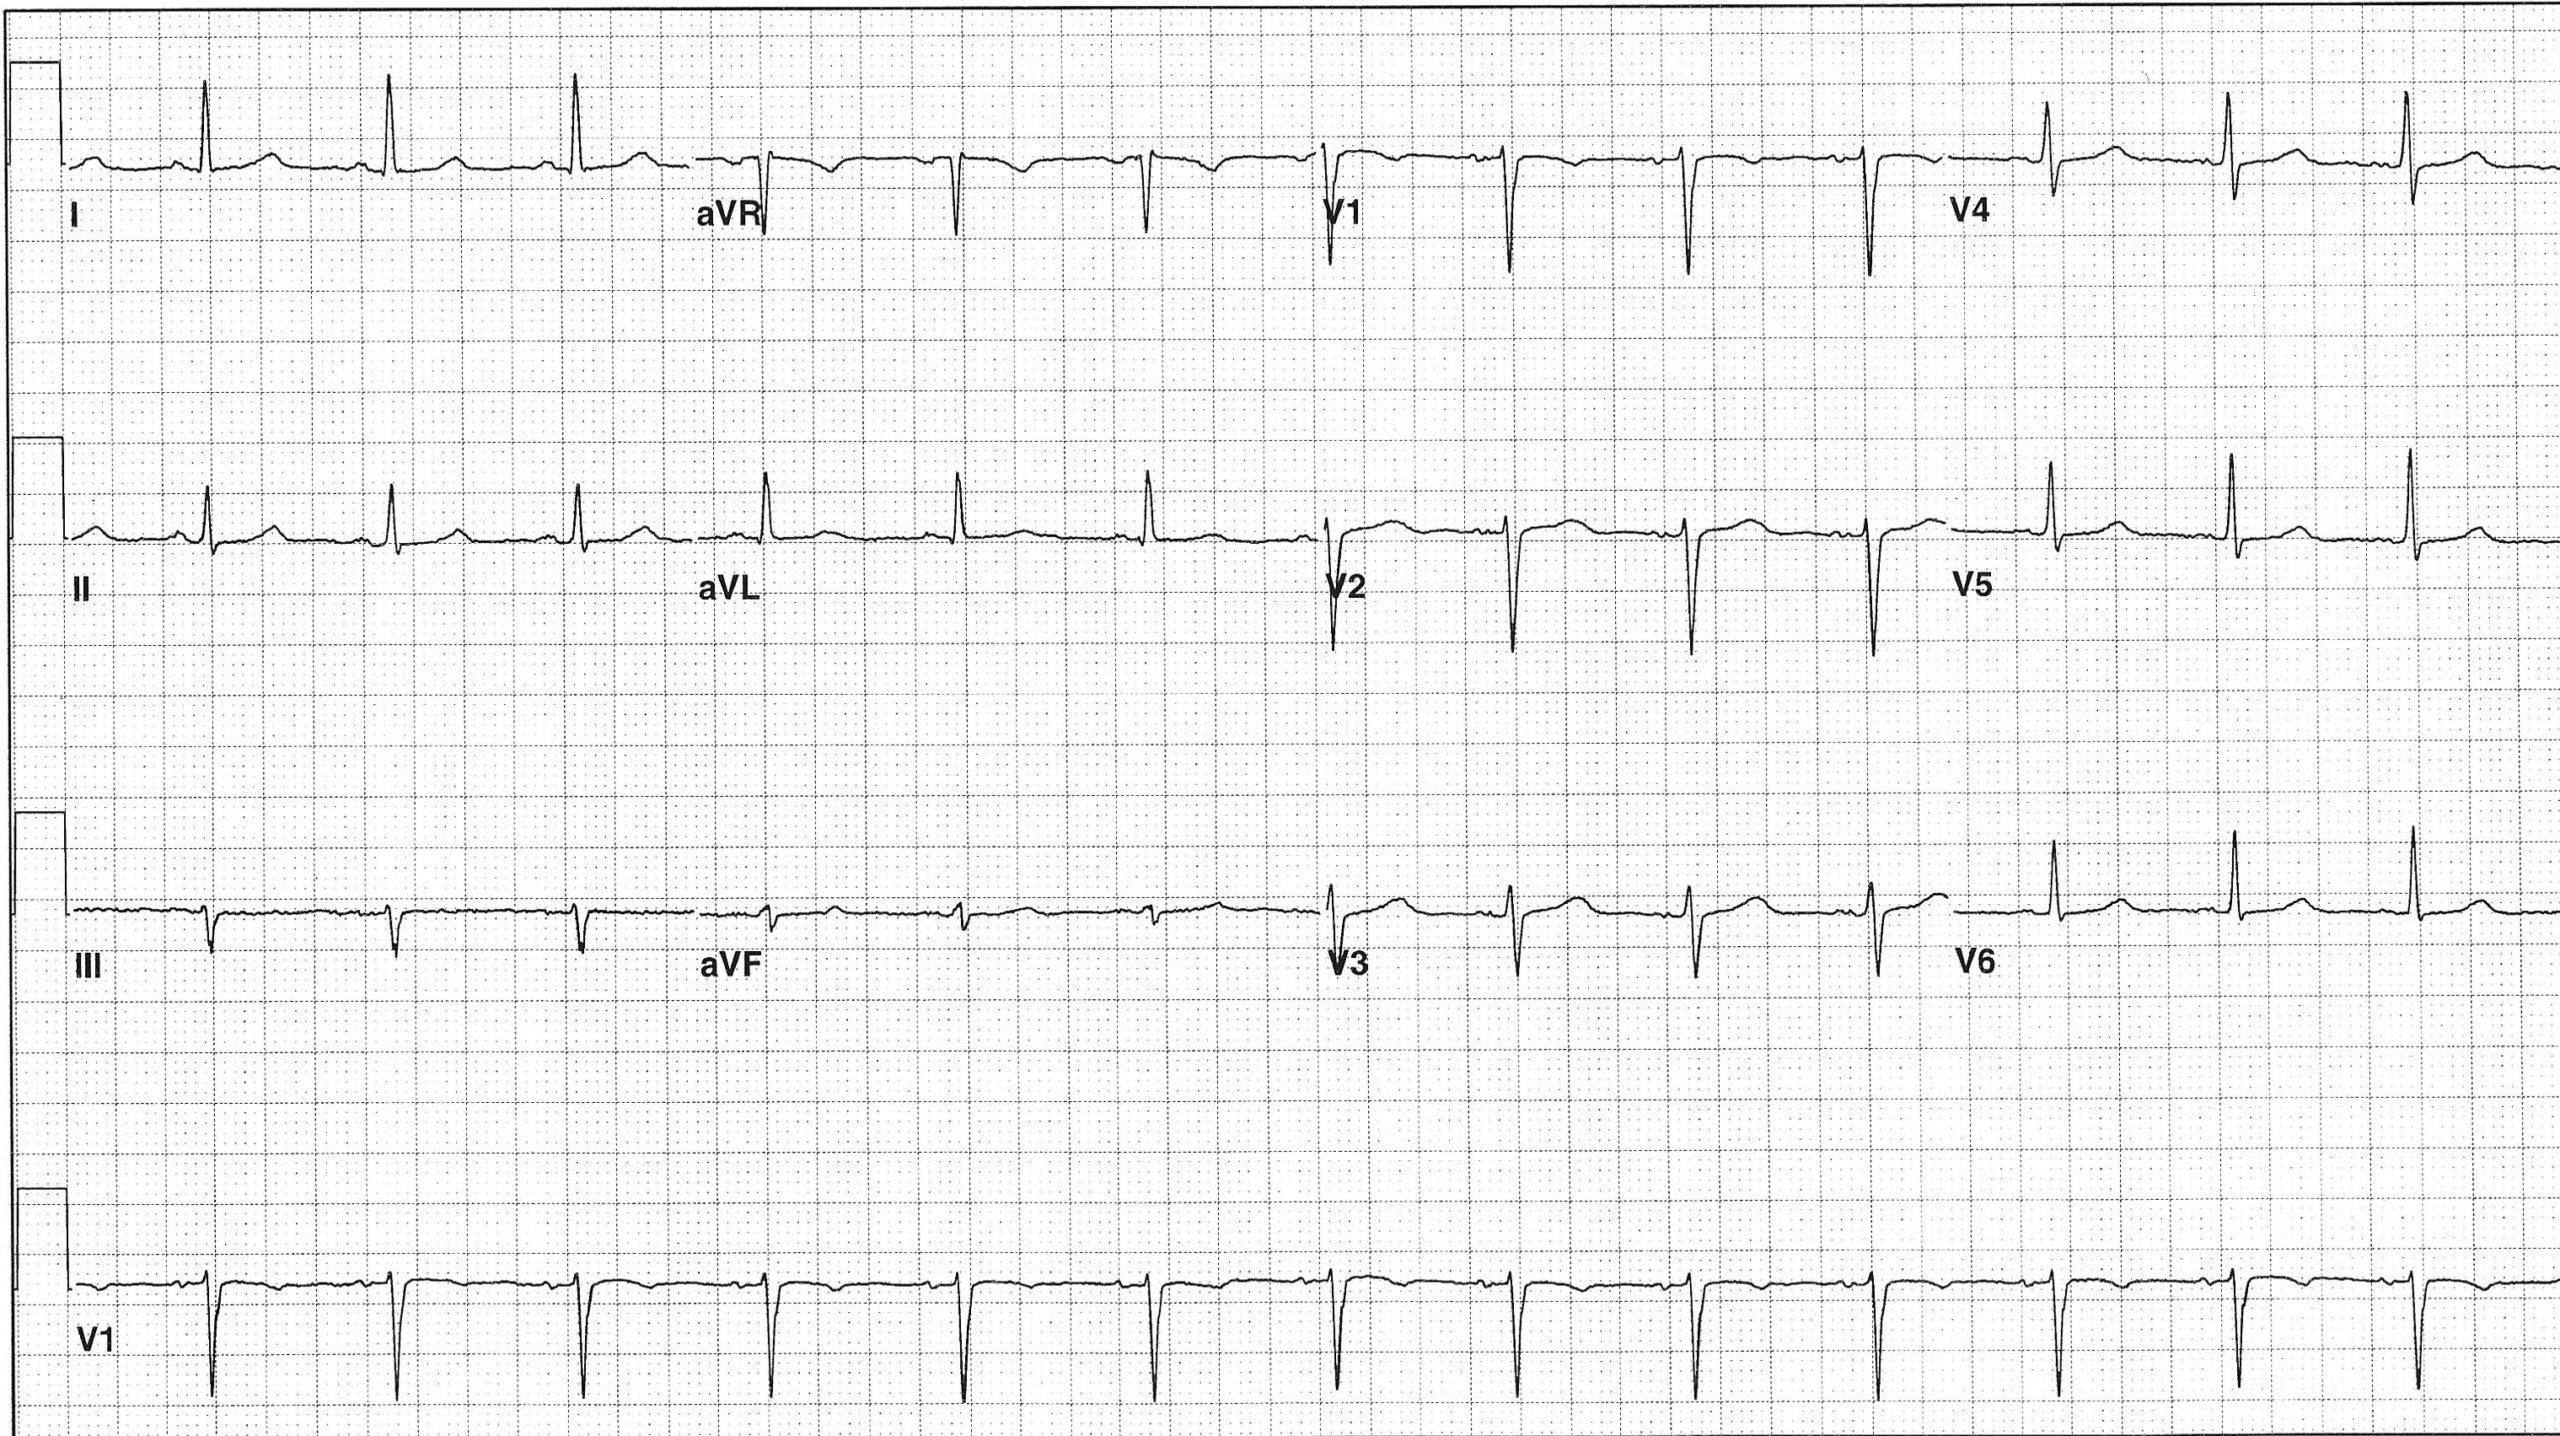
A 12-lead ECG represents the electrical activity of the heart from twelve different points of view. Let us look at the layout (see below). When we divide the ECG into columns, we see column one encompasses leads 1, 2, and 3; column two contains leads aVR, aVL, and aVF; column 3 comprises leads V1, V2, and V3; and column four covers leads V4, V5, and V6.
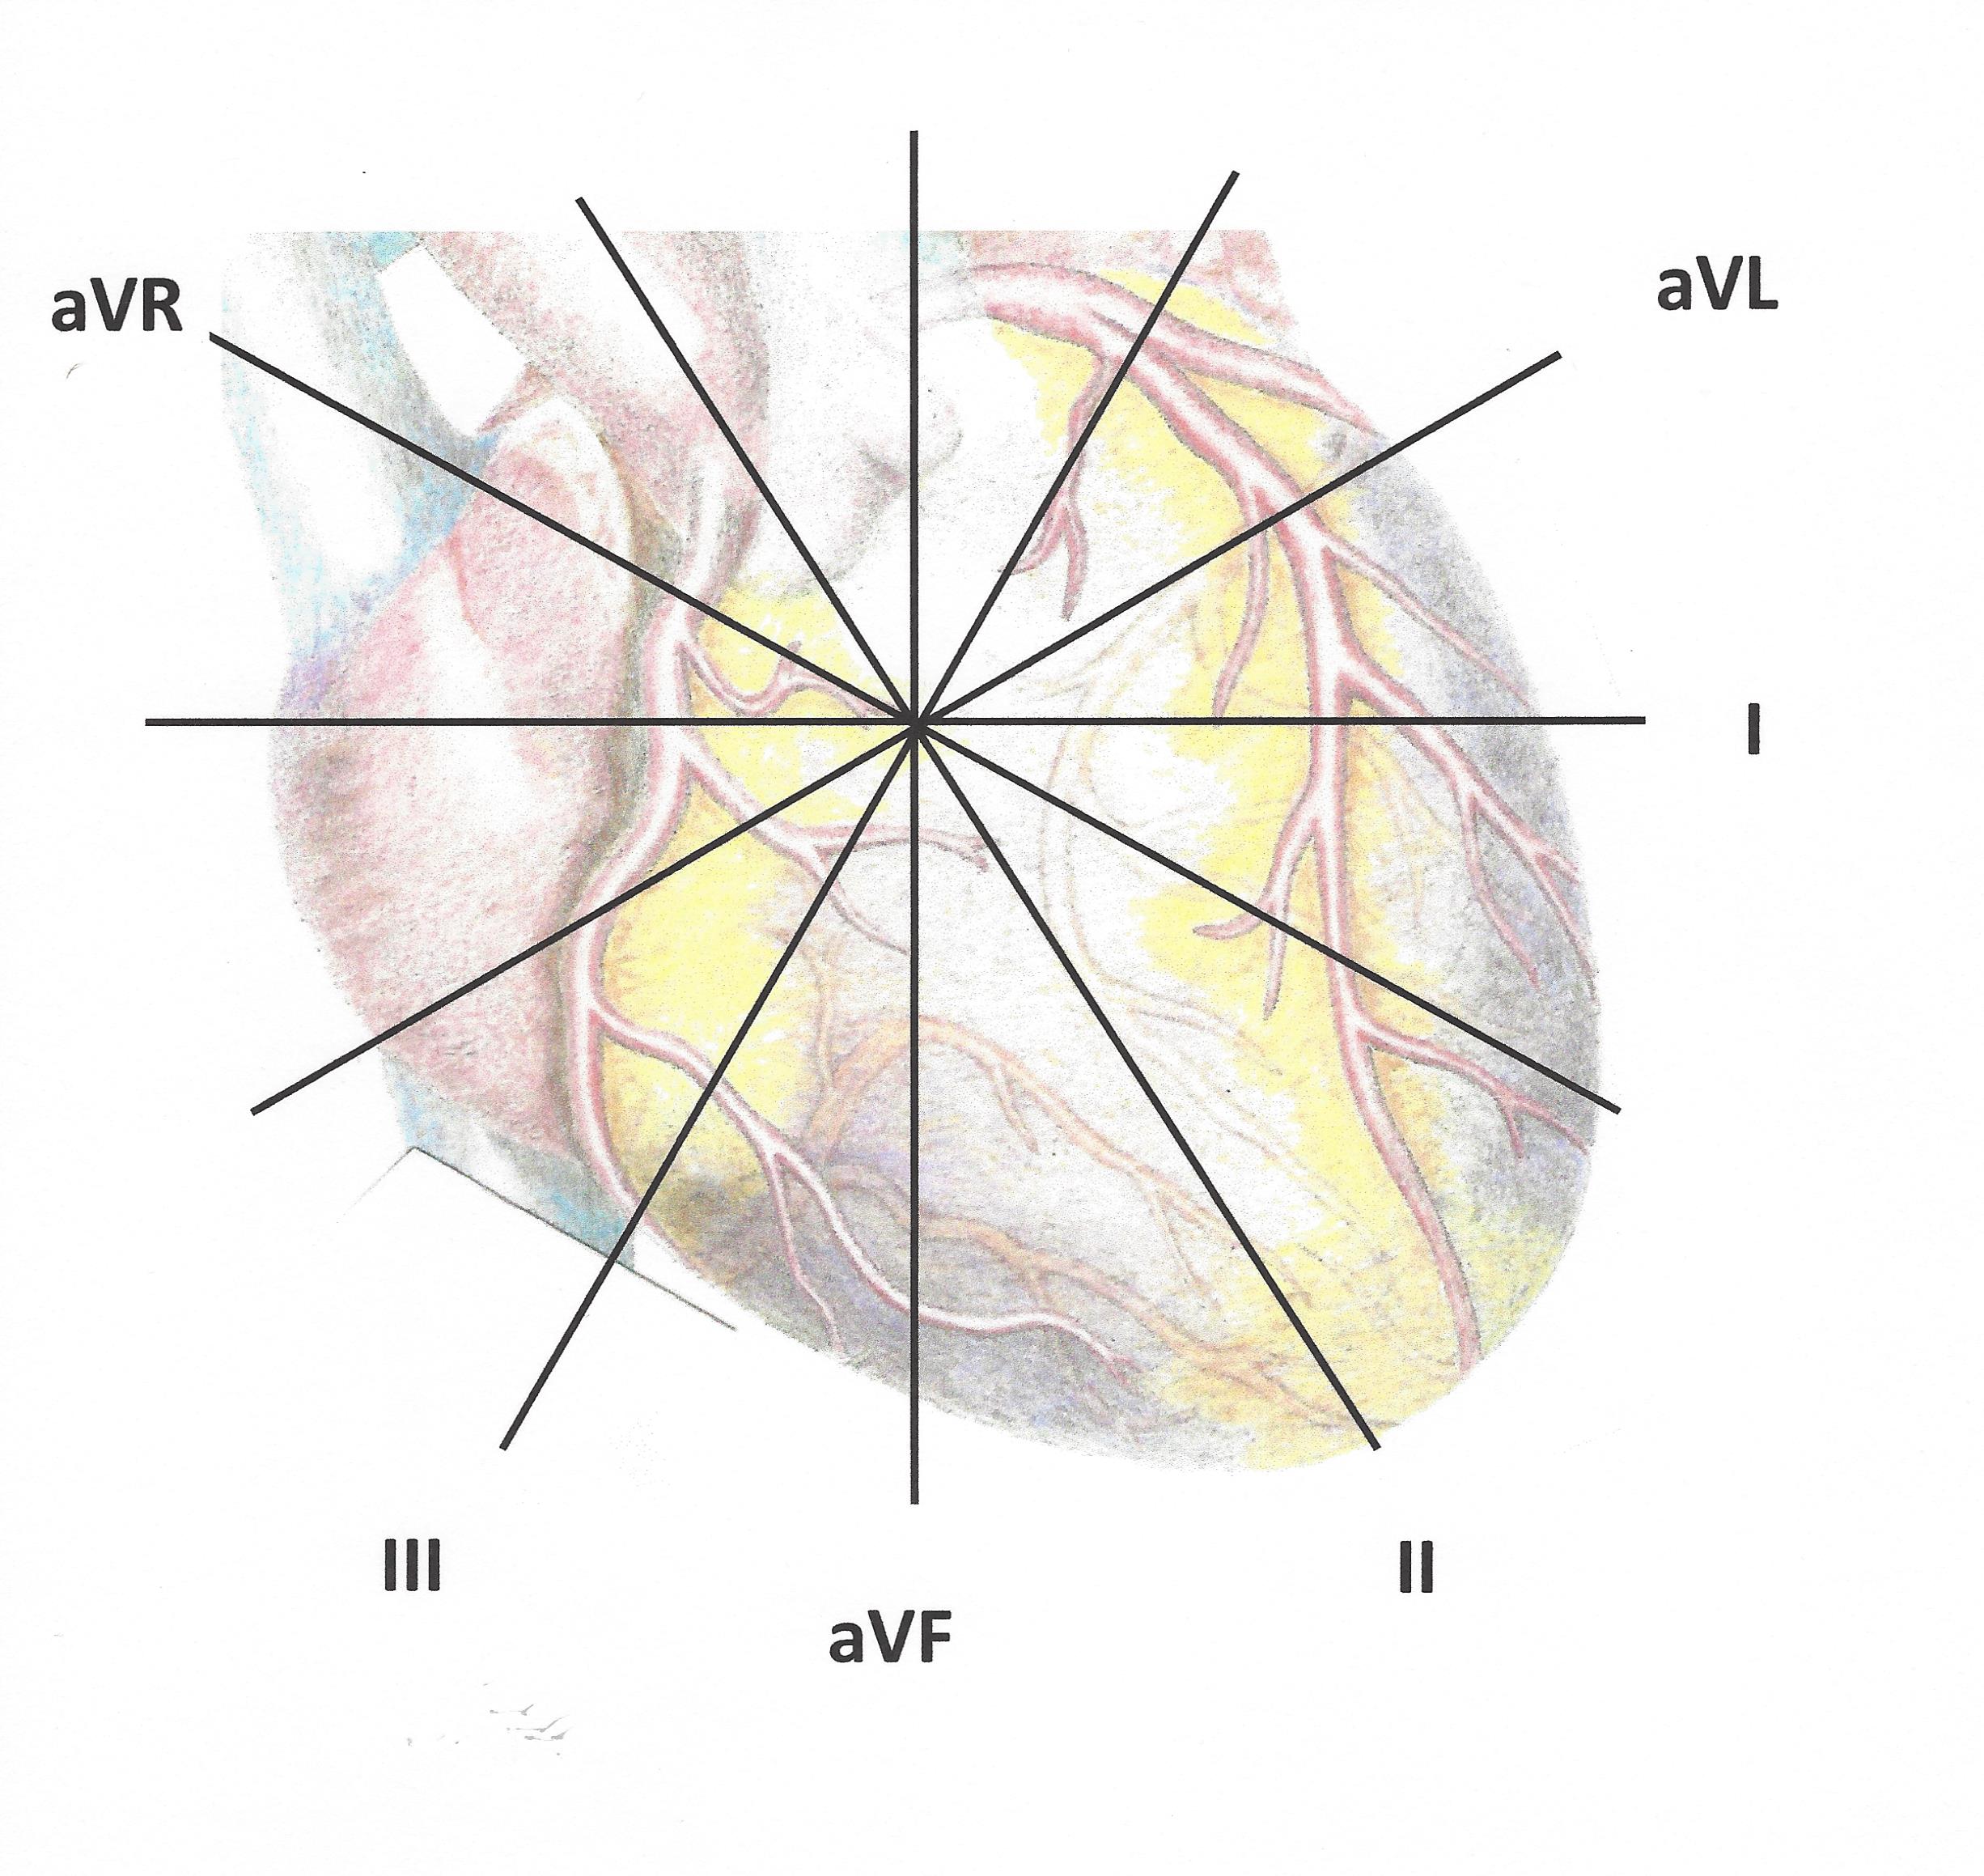
When we look at the position of the limb leads, superimposed on the heart, we see that leads 2, 3, and aVF correspond with the bottom or “inferior” portion of the heart. Leads 1 and aVL correspond with the “high lateral” portion of the heart.
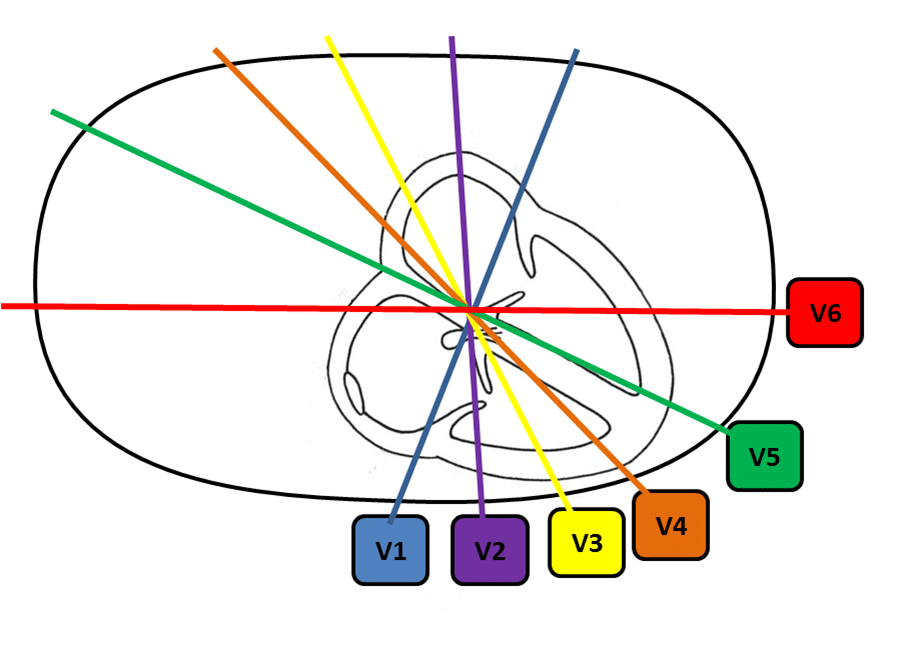
When we look at the position of chest leads, superimposed on a cross-section of the heart, we see that leads V1 and V2 correspond with the intraventricular septum or “septal” portion of the heart. Leads V2 and V3 correspond with the “anterior” portion of the left ventricle. Finally, leads V5 and V6 correlate with the lateral portion of the left ventricle.
Criteria for a Myocardial Infarction
Q waves define a myocardial infarction on an ECG. Q waves must be present in two contiguous leads, that is two leads that are anatomically next to each other. The age of the myocardial infarction is determined by the ST and T waves. More about this can be found in the article ‘Recognize And Diagnose Heart Attacks (Myocardial Infarctions)” from Executive Electrocardiogram Education (https://www.ecgedu.com/recognize-and-diagnose-heart-attacks/). For completeness, the next section reviews the different waveforms of the ECG.
ECG Waveform Definitions
These definitions can easily be found in the glossary section from the online, ECG video course, Executive Electrocardiogram Education, ecgedu.com. Furthermore, ecgedu.com teaches beginners, as well as advanced readers, ECG criteria and a system for reading ECGs.
P waves: Deflections on the ECG that represents sinus node, atrial and atrioventricular (AV) node depolarization.
QRS complexes: Deflections on the ECG that represents ventricular depolarization.
Q waves: First downward deflection before an R wave of the QRS complex.
R wave: First upward deflection of the QRS complex.
S wave: First downward deflection after an R wave of the QRS complex.
R prime (R’): Second upward deflection of the QRS complex.
S prime (S’): Second downward deflection after an R wave of the QRS complex.
R double prime (R’’): Third upward deflection of the QRS complex.
S double prime (S’’): Third downward deflection after an R wave of the QRS complex.
ST segments: Deflections on the ECG that occurs between the QRS complex and the T wave.
T waves: Deflections on the ECG after the ST segment.

ECG Question #2:
Your same colleague calls you with a new ECG and again, asks for your assistance. “Now I have an ECG in which the computer says “low QRS voltage.” What is low QRS voltage, and what do I look for?
ECG Response #2:
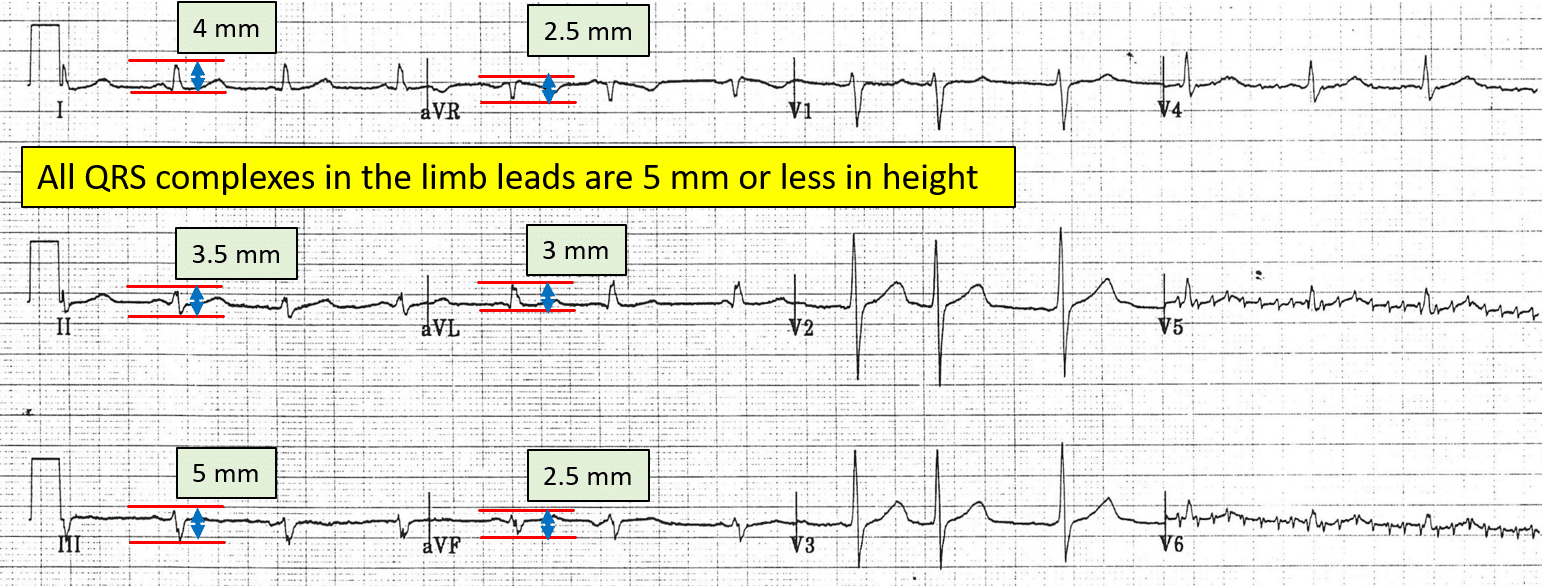
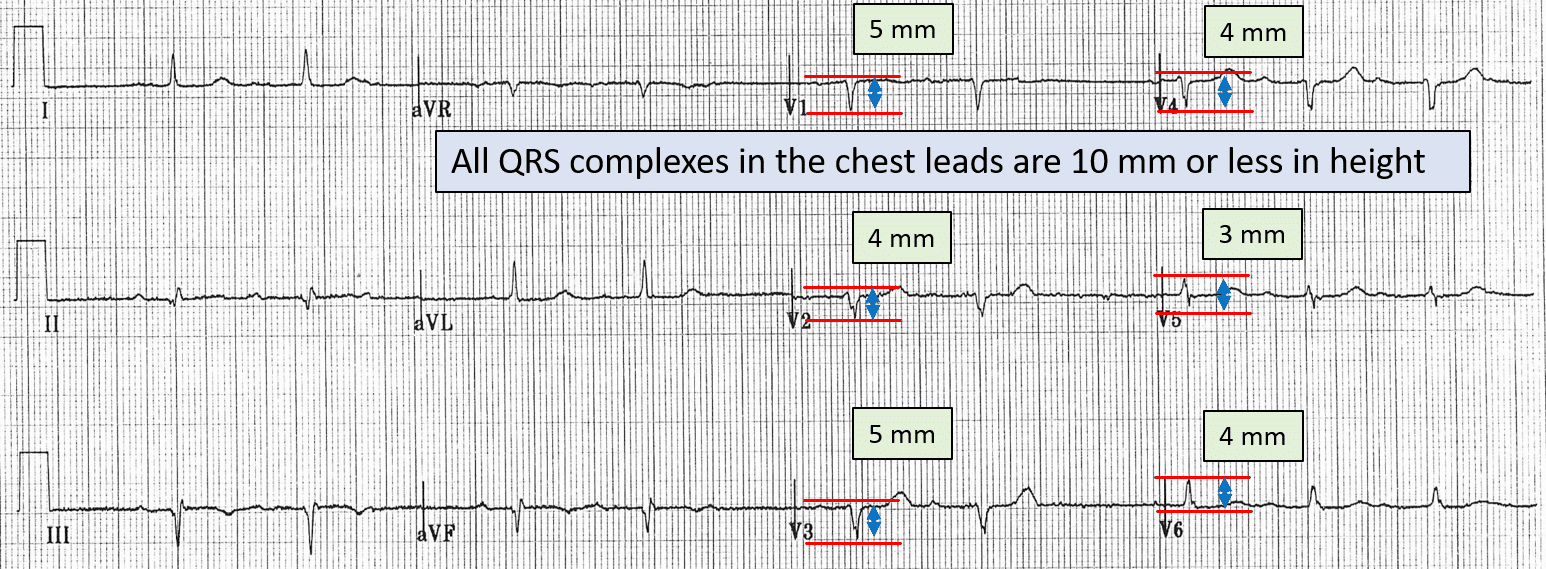
You reply, “That’s actually very easy. In low voltage, you look at the total height of all of the QRS complexes in all of the leads. The total height is from the top of the R waves to the bottom of the S waves. If the total height of the QRS complexes in the limb leads (leads 1, 2, 3, aVR, aVL, and aVF) are less than 5 mm, that is low voltage. Additionally, if the total height of the QRS complexes in the chest leads (leads V1, V2, V3, V4, V5, and V6) are less than 10 mm, that, too, is low voltage. You also tell your colleague that low voltage is a significant ECG finding and that the patient should be evaluated to make sure that no life-threatening conditions exist.
ECG Solution #2:
Based on this question we need to know the definition and criteria for low voltage. Although stated in the answer above low voltage is defined below. Again, these definitions are easily found in the glossary section of glossary section from the online, ECG video course, Executive Electrocardiogram Education, ecgedu.com
An ECG finding in which either:
•All of the QRS complexes in the limb leads are < 5 mm tall (from the top of the R wave to the bottom of the S wave) or
•All of the QRS complexes in the chest leads are < 10 mm tall (from the top of the R wave to the bottom of the S wave).
Remember that low QRS can be associated with cardiac emergencies like large pericardial effusions, cardiac tamponade, tension pneumothorax, extensive myocardial infarction, acute myocarditis, severe hypothyroidism, and other conditions.
Conclusion
Electrocardiograms are not hard to read if you have a little basic knowledge and a system. Always define the terms, understand how to put the information together, and then finally make your diagnoses and plans.