While it may seem like a complex concept, with the right instruction, learning how to read an ECG is a lot less daunting than it may seem. The real trick to learning to read and interpret ECGs is to follow a system.
A systematic approach, such as the one taught in our ECG interpretation courses, assures that you will not miss a step or a diagnosis. Through repetition and muscle memory, a system eventually becomes automatic.
Keep reading to learn a little more about what an ECG is and how to read EKGs like a pro.
ECG Components
An electrocardiogram (ECG) is a noninvasive test that measures the electrical activity of the heart. It is used to diagnose and monitor many types of heart conditions.
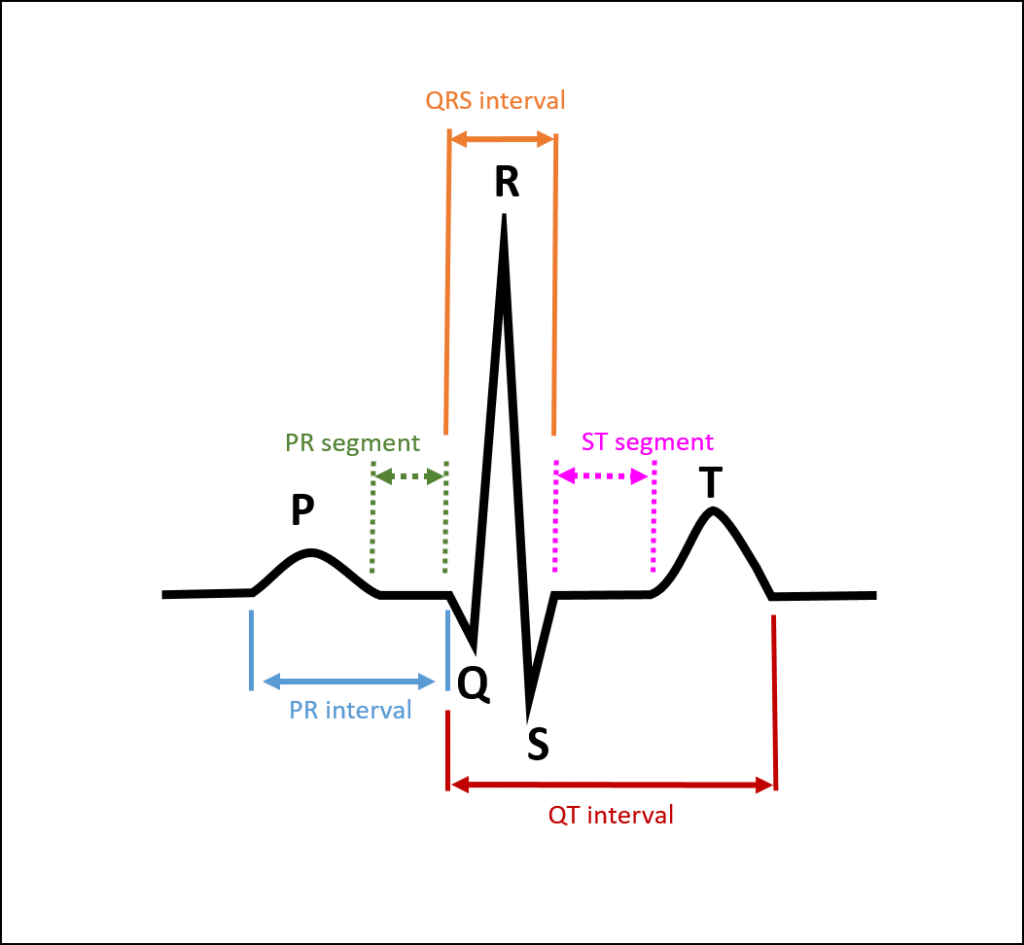
An ECG consists of several components, including the P wave, QRS complex, and T wave. Each component provides important information about the heart’s electrical activity. In this article, we will discuss the components of an ECG and how they are used to diagnose and monitor heart conditions.
P Wave
The P wave is the first waveform on an ECG and represents atrial depolarization. It is usually relatively low in amplitude. Typically, it should be upright in leads I, II, and III, and is usually biphasic or inverted in aVR.
QRS Complex
The QRS complex is the second waveform on an ECG and represents ventricular depolarization. It is usually larger than the P wave in amplitude and has a duration of 0.06 to 0.11 seconds. Typically, it should be upright in leads I, II, and V3-V6, and is usually biphasic or downgoing in aVR and V1.
T Wave
The T wave is the third waveform on an ECG and represents ventricular repolarization. It is usually smaller than the QRS complex in amplitude. Typically, it should be upright in leads I, II, and V3-V6, is usually biphasic or down going in aVR and V1, and is in the same direction as the QRS complex.
Interpreting an ECG
Interpreting an ECG requires a knowledge of the components that make up an electrocardiogram and how they are used to identify and treat heart conditions. With this data doctors are better able to assess potential risks associated with certain treatments or lifestyle choices for their patients.
Learn How To Read ECGs With Our Basic ECG Interpretation Course
Abnormal ECG Readings
Abnormal ECG readings can indicate a variety of conditions ranging from minor abnormalities to life-threatening cardiac conditions. Some examples include atrial fibrillation, complete heart block, ventricular tachycardia, and bundle branch block.
Atrial Fibrillation
Atrial fibrillation is a type of abnormal heart rhythm characterized by an irregular and rapid heartbeat. On an ECG, it can be identified by a squiggly baseline without identifiable P waves; narrow, but irregularly spaced QRS complexes, and normal T waves.
Complete Heart Block
Complete heart block is a type of abnormal heart rhythm typically characterized by a slow or absent heartbeat. On an ECG, it can be identified by regularly spaced P waves, regularly spaced QRS complexes, and varying PR intervals. Since there is no functioning connection between the atria and the ventricles, there are two independent rhythms (an atrial rhythm and a ventricular rhythm) superimposed on one rhythm strip.
Ventricular Tachycardia
Ventricular tachycardia is a type of abnormal heart rhythm characterized by a rapid heartbeat. On an ECG, it can be identified by a wide QRS complex, absent P waves, and a rate of more than 100 beats per minute.
Bundle Branch Block
Bundle branch block is a type of conduction abnormality characterized by wide QRS complexes following P waves. They are due to a conduction delay in the left or right bundle. The bundles are the normal conduction pathways for an impulse going through the ventricles. Since there are two bundles, there are two main bundle branch blocks, the right bundle branch block (RBBB) and the left bundle branch block (LBBB). Both have wide QRS complexes. A classic RBBB has an rSR’ pattern in lead V1 and an rS pattern in lead V6. The QRS complexes in an LBBB are typically down going in lead V1, and upright in leads 1, aVL, V5, and V6.
What Are ECG Leads?
Understanding how ECG leads work is essential when learning how to read an ECG. Leads are simply a graph of the electrical activity of the heart. They are recorded through electrodes that are placed on the body. Each lead provides important information about the heart’s electrical activity. In this article, we will discuss the different types of ECG leads and how they are used to diagnose and monitor heart conditions.
Standard 12-Lead ECG
An ECG is recorded using multiple electrodes placed on the chest or limbs. These electrodes record different electrical signals from different parts of the heart and are known as leads.
The standard 12-lead ECG consists of 12 different leads that provide information about different parts of the heart. Essentially, it is like looking at the heart from 12 different points of view. It can provide information about both electrical activity and structural abnormalities in the heart.
Additional Leads
In addition to the standard 12-lead ECG, there are several other leads available for use in certain clinical situations such as monitoring patients with arrhythmias, other heart conditions, or even a pulmonary embolism. These leads provide more detailed information about specific parts of the heart than the standard 12-lead ECG, such as leads V4R, V7-V9, and RV1-RV6.
The ECGEDU Approach To Reading ECGs
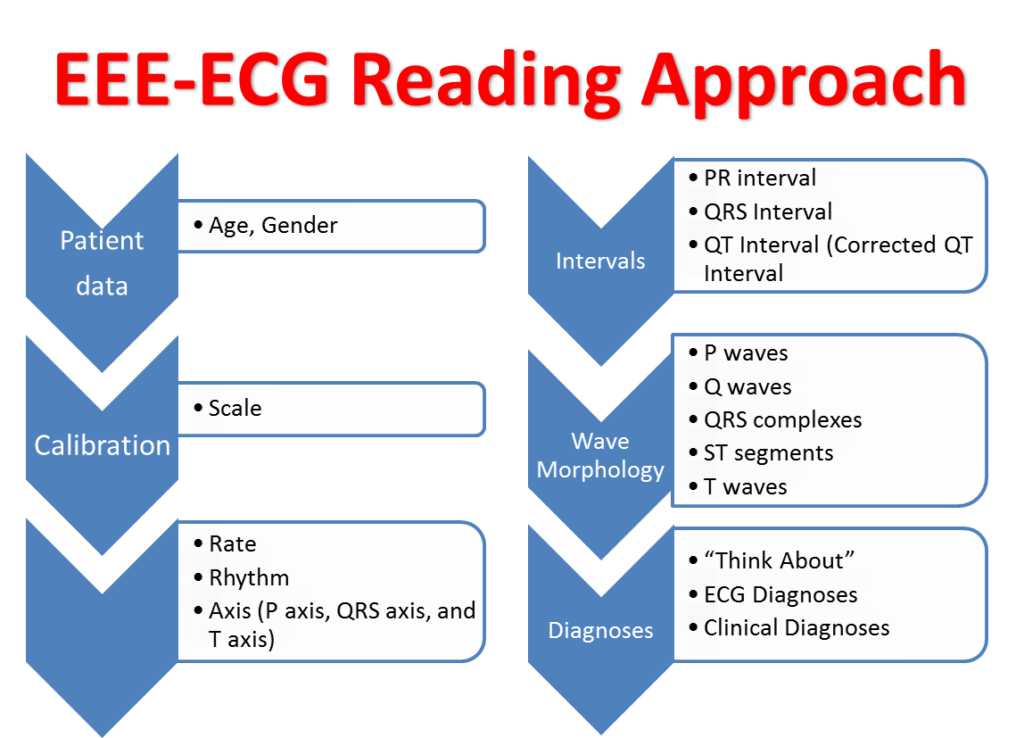
The ECGEDU approach to reading ECGs which is based on the ACC/AHA ECG reading guidelines is as follows. First, check the patient’s age and gender if available. Next look at the ECG scale. Now, read the heart rate and rhythm, then calculate the axes and intervals.
Next, you look at the wave morphology: P waves, Q waves, QRS complexes, ST segments; and finally, T waves. All of the diagnoses go into the ECG diagnosis section. Finally, assign clinical diagnoses, if possible. This is no different from how cardiologists read ECGs, but it is laid out simply. Let’s look at each step in a little more detail.
1. Assess Age and Gender
The ECG technician often types the patient’s name and gender at the top of the ECG.
2. Analyze The Rate and Rhythm
Always remember to check both the atrial heart rate (P wave rate) and the ventricular rate (QRS complex rate). Most of the time they are the same, but they can be different. For example, in sinus bradycardia and normal atrioventricular node function, both the atrial rate and the ventricular rate are less than 60 beats per minute. In atrial fibrillation with a controlled ventricular response, the atrial rate is greater than 350 beats per minute and the ventricular rate is between 60 and 100 beats per minute.
In order to accurately name the heart rhythm, you need to look at two factors. Impulse formation is the first and impulse conduction is the second.
Impulse Formation
Impulse formation describes where an impulse originates and the characteristics of the impulse. For example, does the impulse begin in the sinoatrial node, the atria, the atrioventricular node, or the ventricles?
Impulse Conduction
Impulse conduction describes how impulses travel through various cardiac tissue. For example, does the impulse travel normally from the sinus node, through the atria, through the atrioventricular node, into the bundle of His, through the right and left bundle branches, and into the Purkinje fibers?
Naming Rhythms
Ultimately, rhythms are named by where they originate and then something about their rate. For example, a rhythm that originates from the sinoatrial node at a rate greater than 100 beats per minute is called sinus tachycardia. A rhythm that originates from the ventricle at a rate between 40 and 100 beats per minute is called an accelerated idioventricular rhythm (AIVR).
Abnormal Rhythms (Arrhythmias)
Arrhythmias are abnormalities of impulse formation and/or conduction. For example, complete heart block (an impulse conduction abnormality), resulting in a ventricular escape rhythm (an impulse formation abnormality) may occur concomitantly with sinus tachycardia (another impulse formation abnormality). All of these factors go into making the final rhythm diagnosis.
3. Look At The Axes
The axis describes the overall direction of impulse conduction. This includes P waves, QRS complexes, and T waves. The p waves axis and QRS axis relate to the depolarization of the atria and ventricles, respectively.
The T wave axis relates to the repolarization of the ventricles. Understanding the axes helps determine whether ECG wave changes are primary abnormalities or secondary abnormalities.
4. Read The Intervals
Overall intervals tell about the rate of conduction through the cardiac tissue. The PR interval tells about conduction from the sinoatrial (SA) node, through the atria, and through the atrioventricular (AV) node. ECG readers should measure the PR interval, QRS interval, QT interval, and then calculate the corrected QT interval.
5. Assess Wave Morphology
Looking at the waves and their morphology should follow a consistent and precise pattern.
P Waves
Since heart rhythms generally begin in the sinoatrial (SA) node, P wave analysis is first. For example, is there a left atrial abnormality or a right atrial abnormality?
Q Waves
Next, look for Q waves. Q waves often represent myocardial infarctions. If Q waves are found in contiguous leads, look at the ST segments and T waves in these leads to date the myocardial infarction. If Q waves are found in the inferior leads (suggesting inferior wall myocardial infarction), be sure to look at the posterior leads (V1 and V2) for concomitant posterior wall myocardial infarction.
QRS Complexes
Next, look at the QRS complexes. I typically ask and answer six basic QRS complex questions.
- Are the QRS complexes tall for left ventricular hypertrophy (LVH)?
- Are they small for low QRS voltage?
- Are they wide representing a bundle branch block (BBB) or nonspecific intraventricular conduction delay (IVCD)?
- Are there tall R waves in lead V1, which may suggest right ventricular hypertrophy (RVH), right ventricular conduction abnormalities, or posterior myocardial infarctions?
- Is there poor R wave progression (PRWP) that may suggest an anterior myocardial infarction?
- And lastly, is the transition point in the normal spot?
ST Segments
Now you evaluate the ST segments. Look for ST-segment elevation or depression. ST-segment elevation may indicate subepicardial injury whereas ST-segment depression may indicate a subendocardial injury. Be aware though, that these changes may be due to other conditions (e.g. digoxin toxicity) or even secondary changes due to depolarization problems.
T Waves
Evaluate T wave changes next. T wave inversion may indicate myocardial ischemia, however, other conditions need to be considered. Examples include subdural hematomas, drug effects, and secondary changes from depolarization abnormalities. Peaked T waves may represent hyperkalemia or hyper-acute changes from an early myocardial infarction.
Learn About Our Advanced ECG Interpretation Course
Learn How To Read ECGs On ECGEDU.com
Interpreting an ECG requires knowledge of both cardiac anatomy and physiology as well as experience in interpreting ECGs. Knowing how to interpret an ECG accurately is essential for diagnosing and monitoring various types of heart conditions. Additionally, medical professionals should be familiar with the different types of ECG leads and their specific uses in order to maximize the accuracy of ECG readings.
If you’re interested in learning how to read ECGs or just want to sharpen your ECG interpretation skills, ECGEDU has all of the resources, practice EKG materials, and online ECG courses you will need to start reading ECGs like a pro. We even offer ECG CME credits if you’re looking for an easy way to earn continuing medical education credits online. Click here to browse our online ECG interpretation courses or click here to create your account now.